Barplot
It has bars with lengths proportional to the values that they represent. It is a xy representation that displays the relationship between categorical and numerical variables.
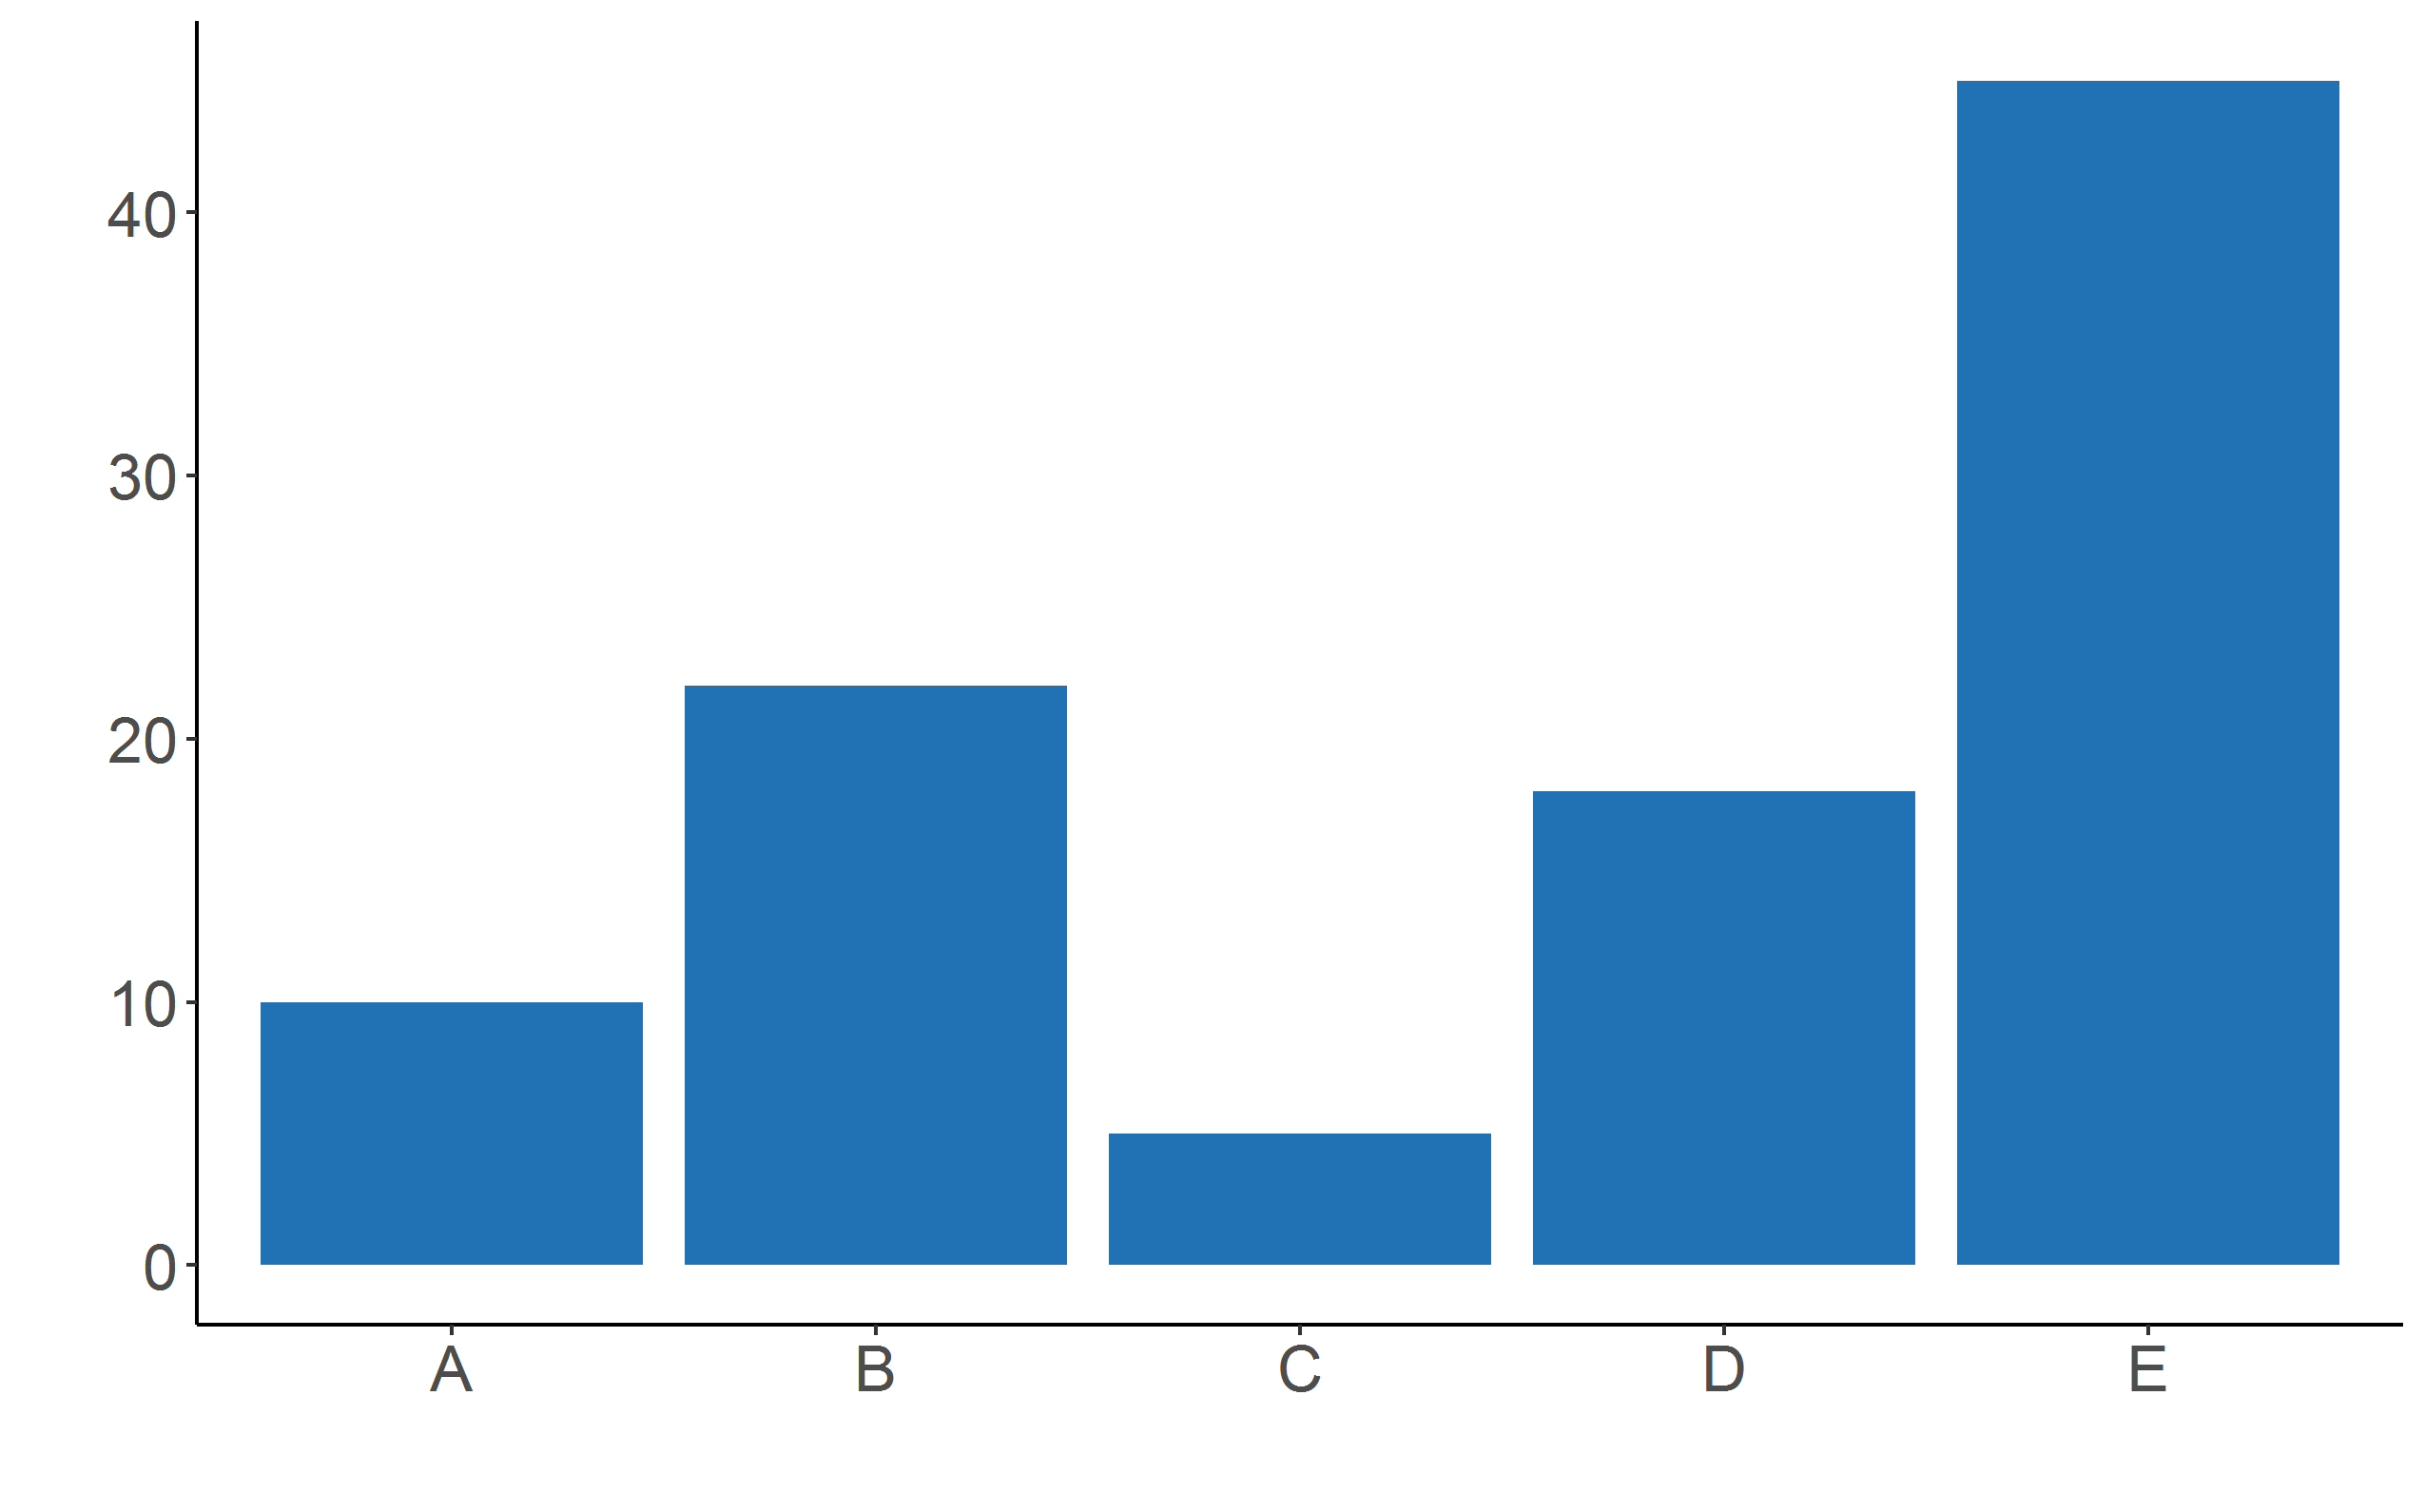
It has bars with lengths proportional to the values that they represent. It is a xy representation that displays the relationship between categorical and numerical variables.