Boxplot
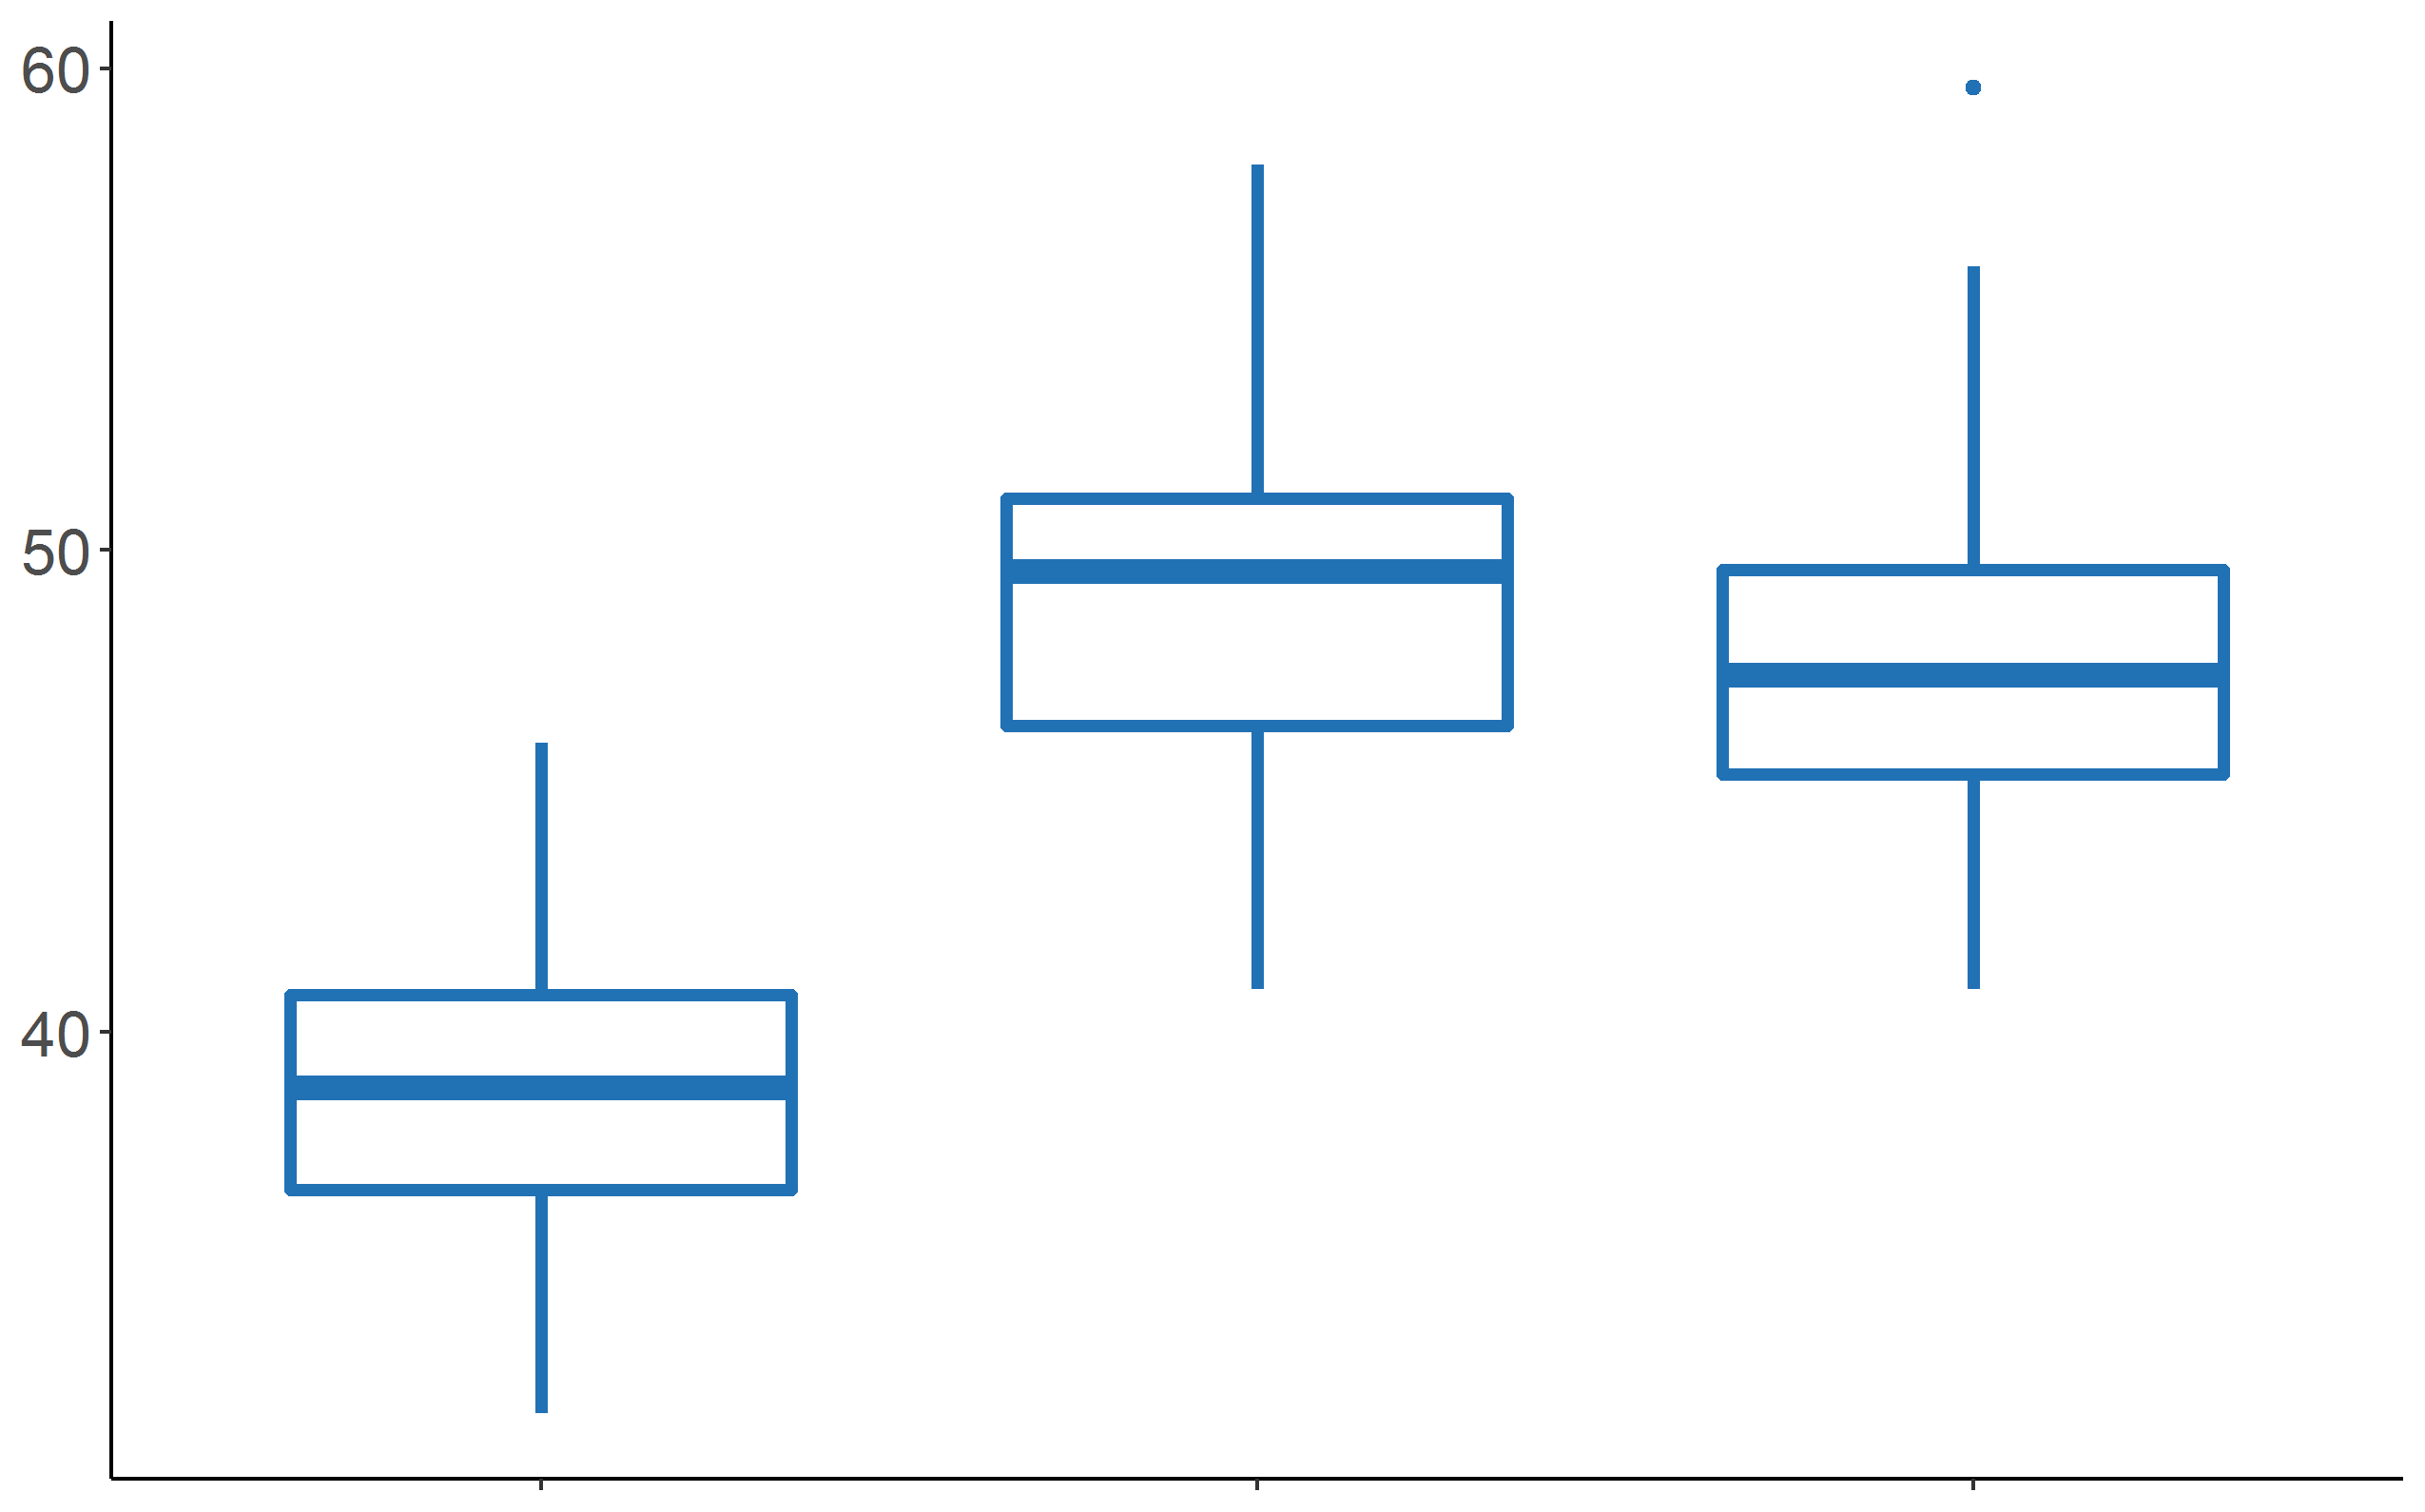
It shows the distribution of a variable using quartiles. The box is crossed by a line (the median or Q2), its base represents the Q1 and its top, the Q3. The lines outside represents Q1-1.5IQR and Q3+1.5IQR. Points correspond to outliers.
It shows the distribution of a variable using quartiles. The box is crossed by a line (the median or Q2), its base represents the Q1 and its top, the Q3. The lines outside represents Q1-1.5IQR and Q3+1.5IQR. Points correspond to outliers.