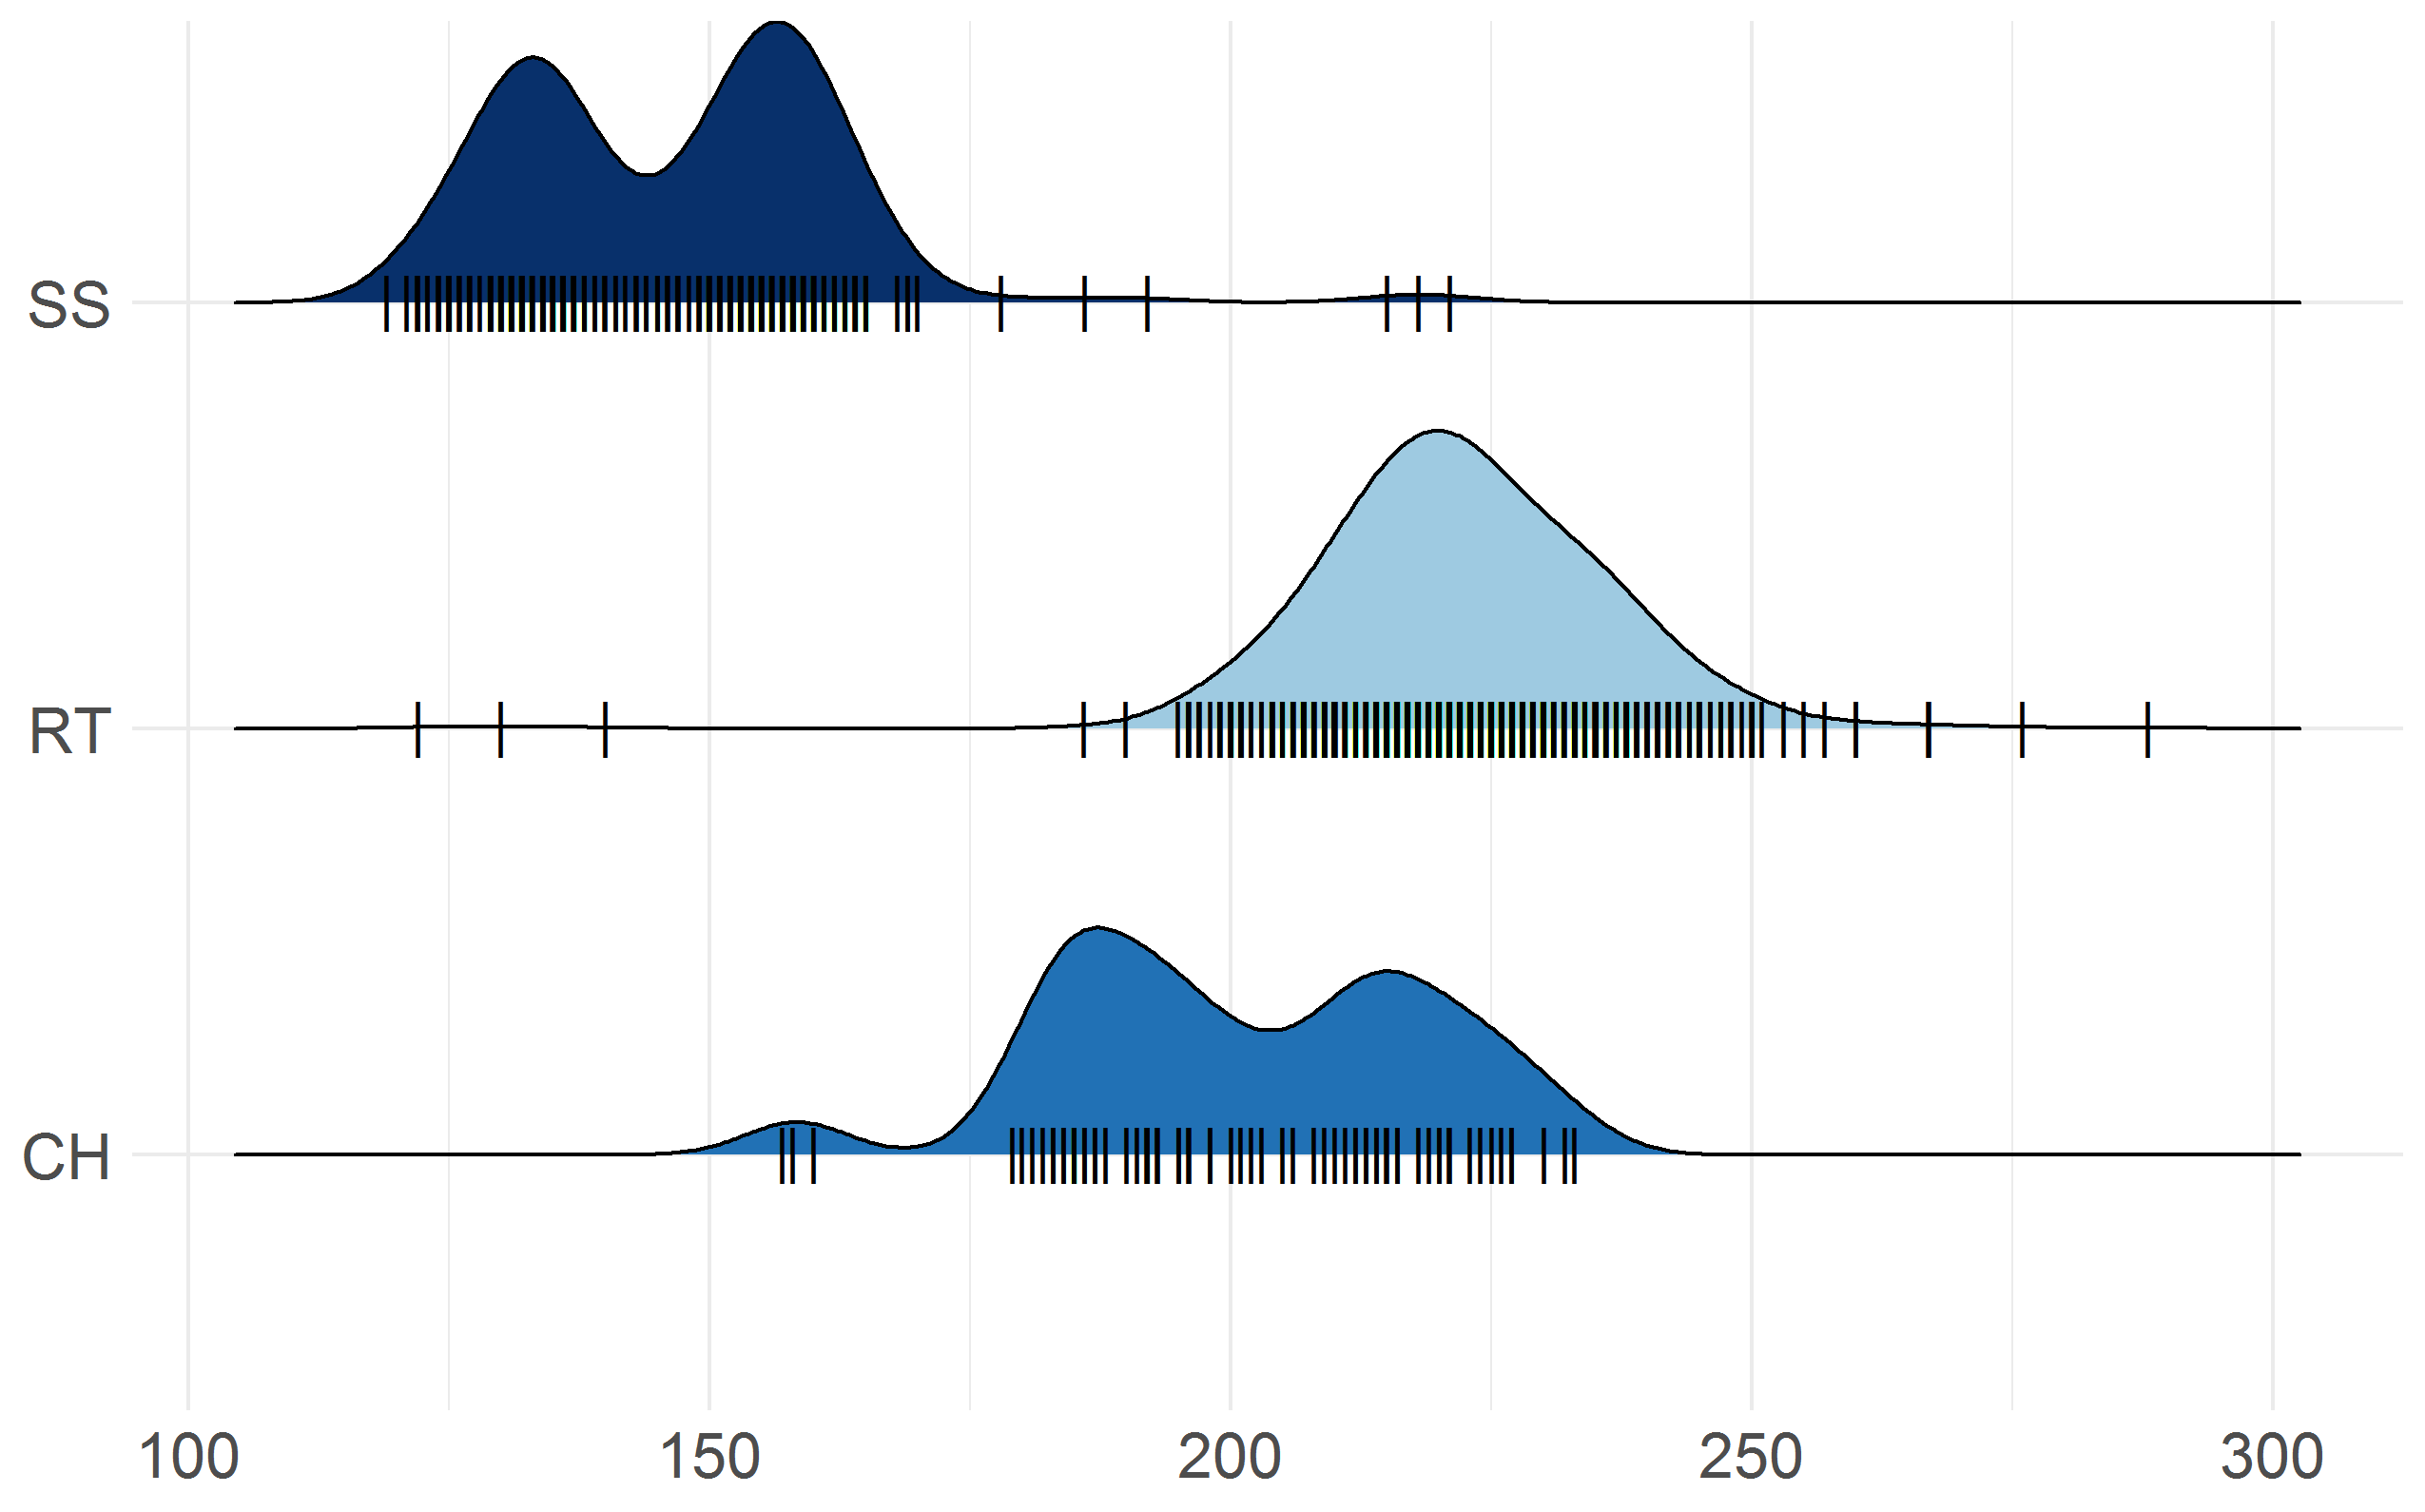
It is a density plot for visualizing changes in distributions, of a continuous variable, over time or space.