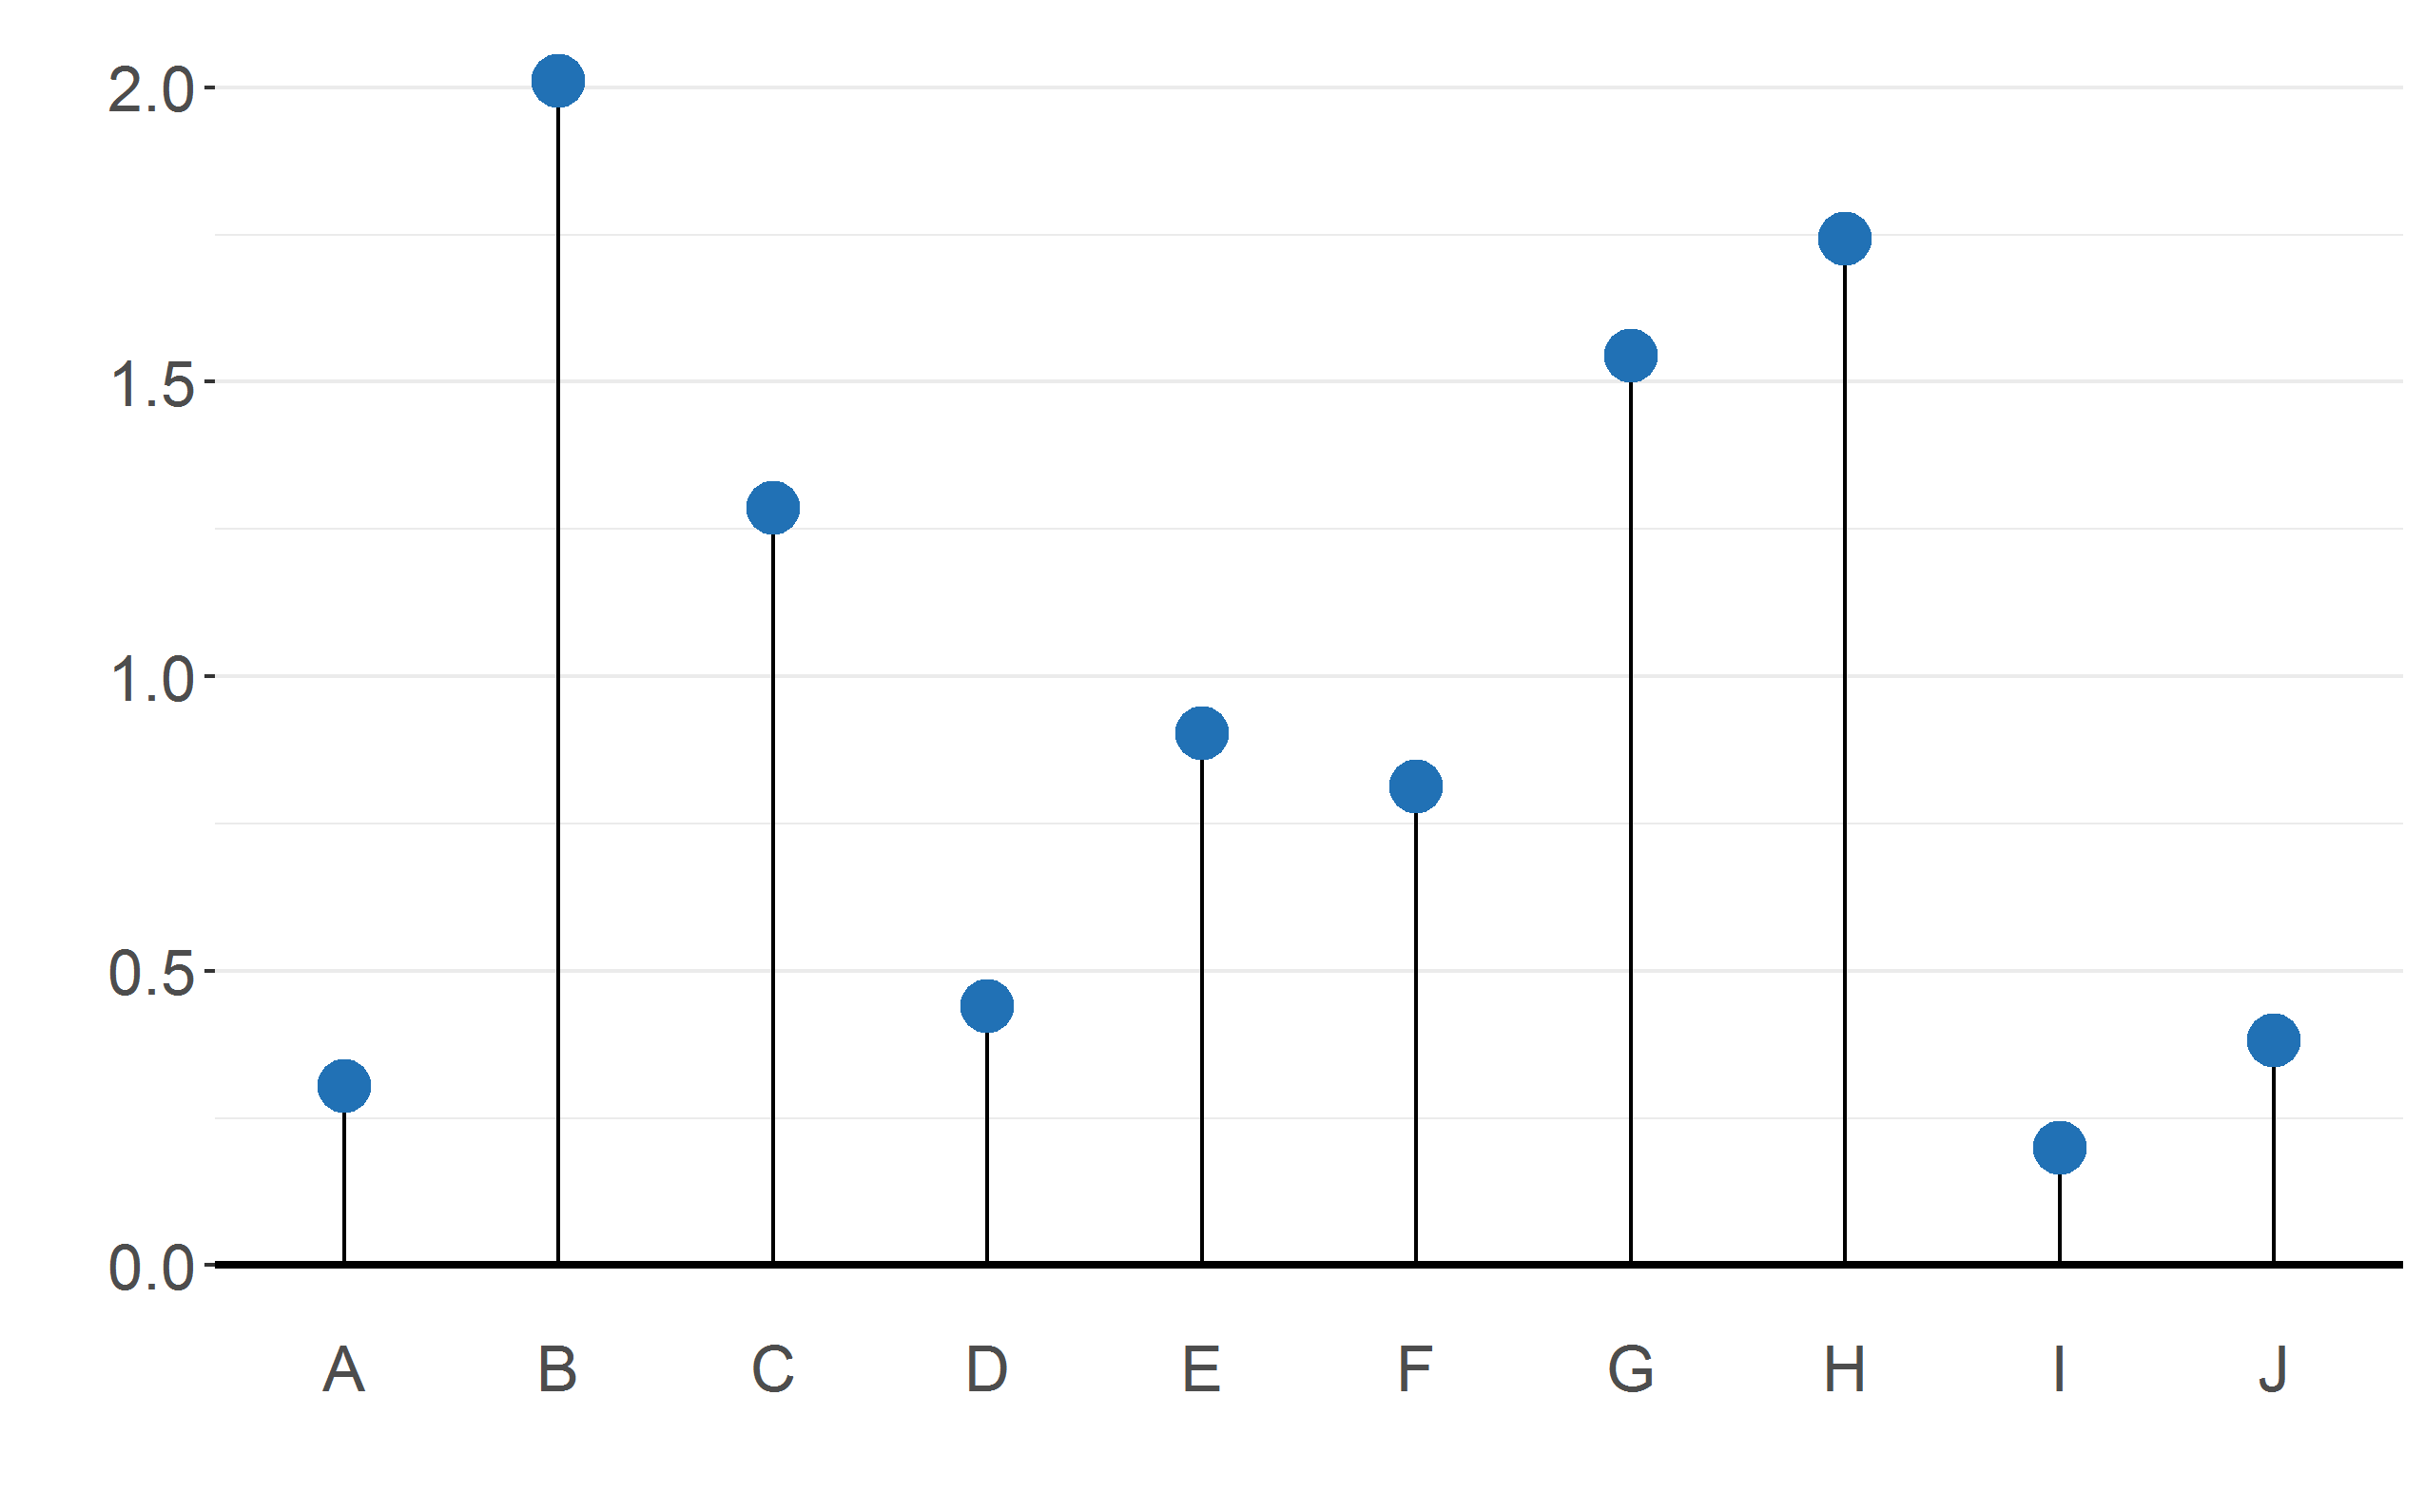
Lollipop Plot
It is like a barplot but the bars are replaced by lines and dots. It also shows relationship between categorical and numerical variables.
It is like a barplot but the bars are replaced by lines and dots. It also shows relationship between categorical and numerical variables.