Percent Stacked Barplot
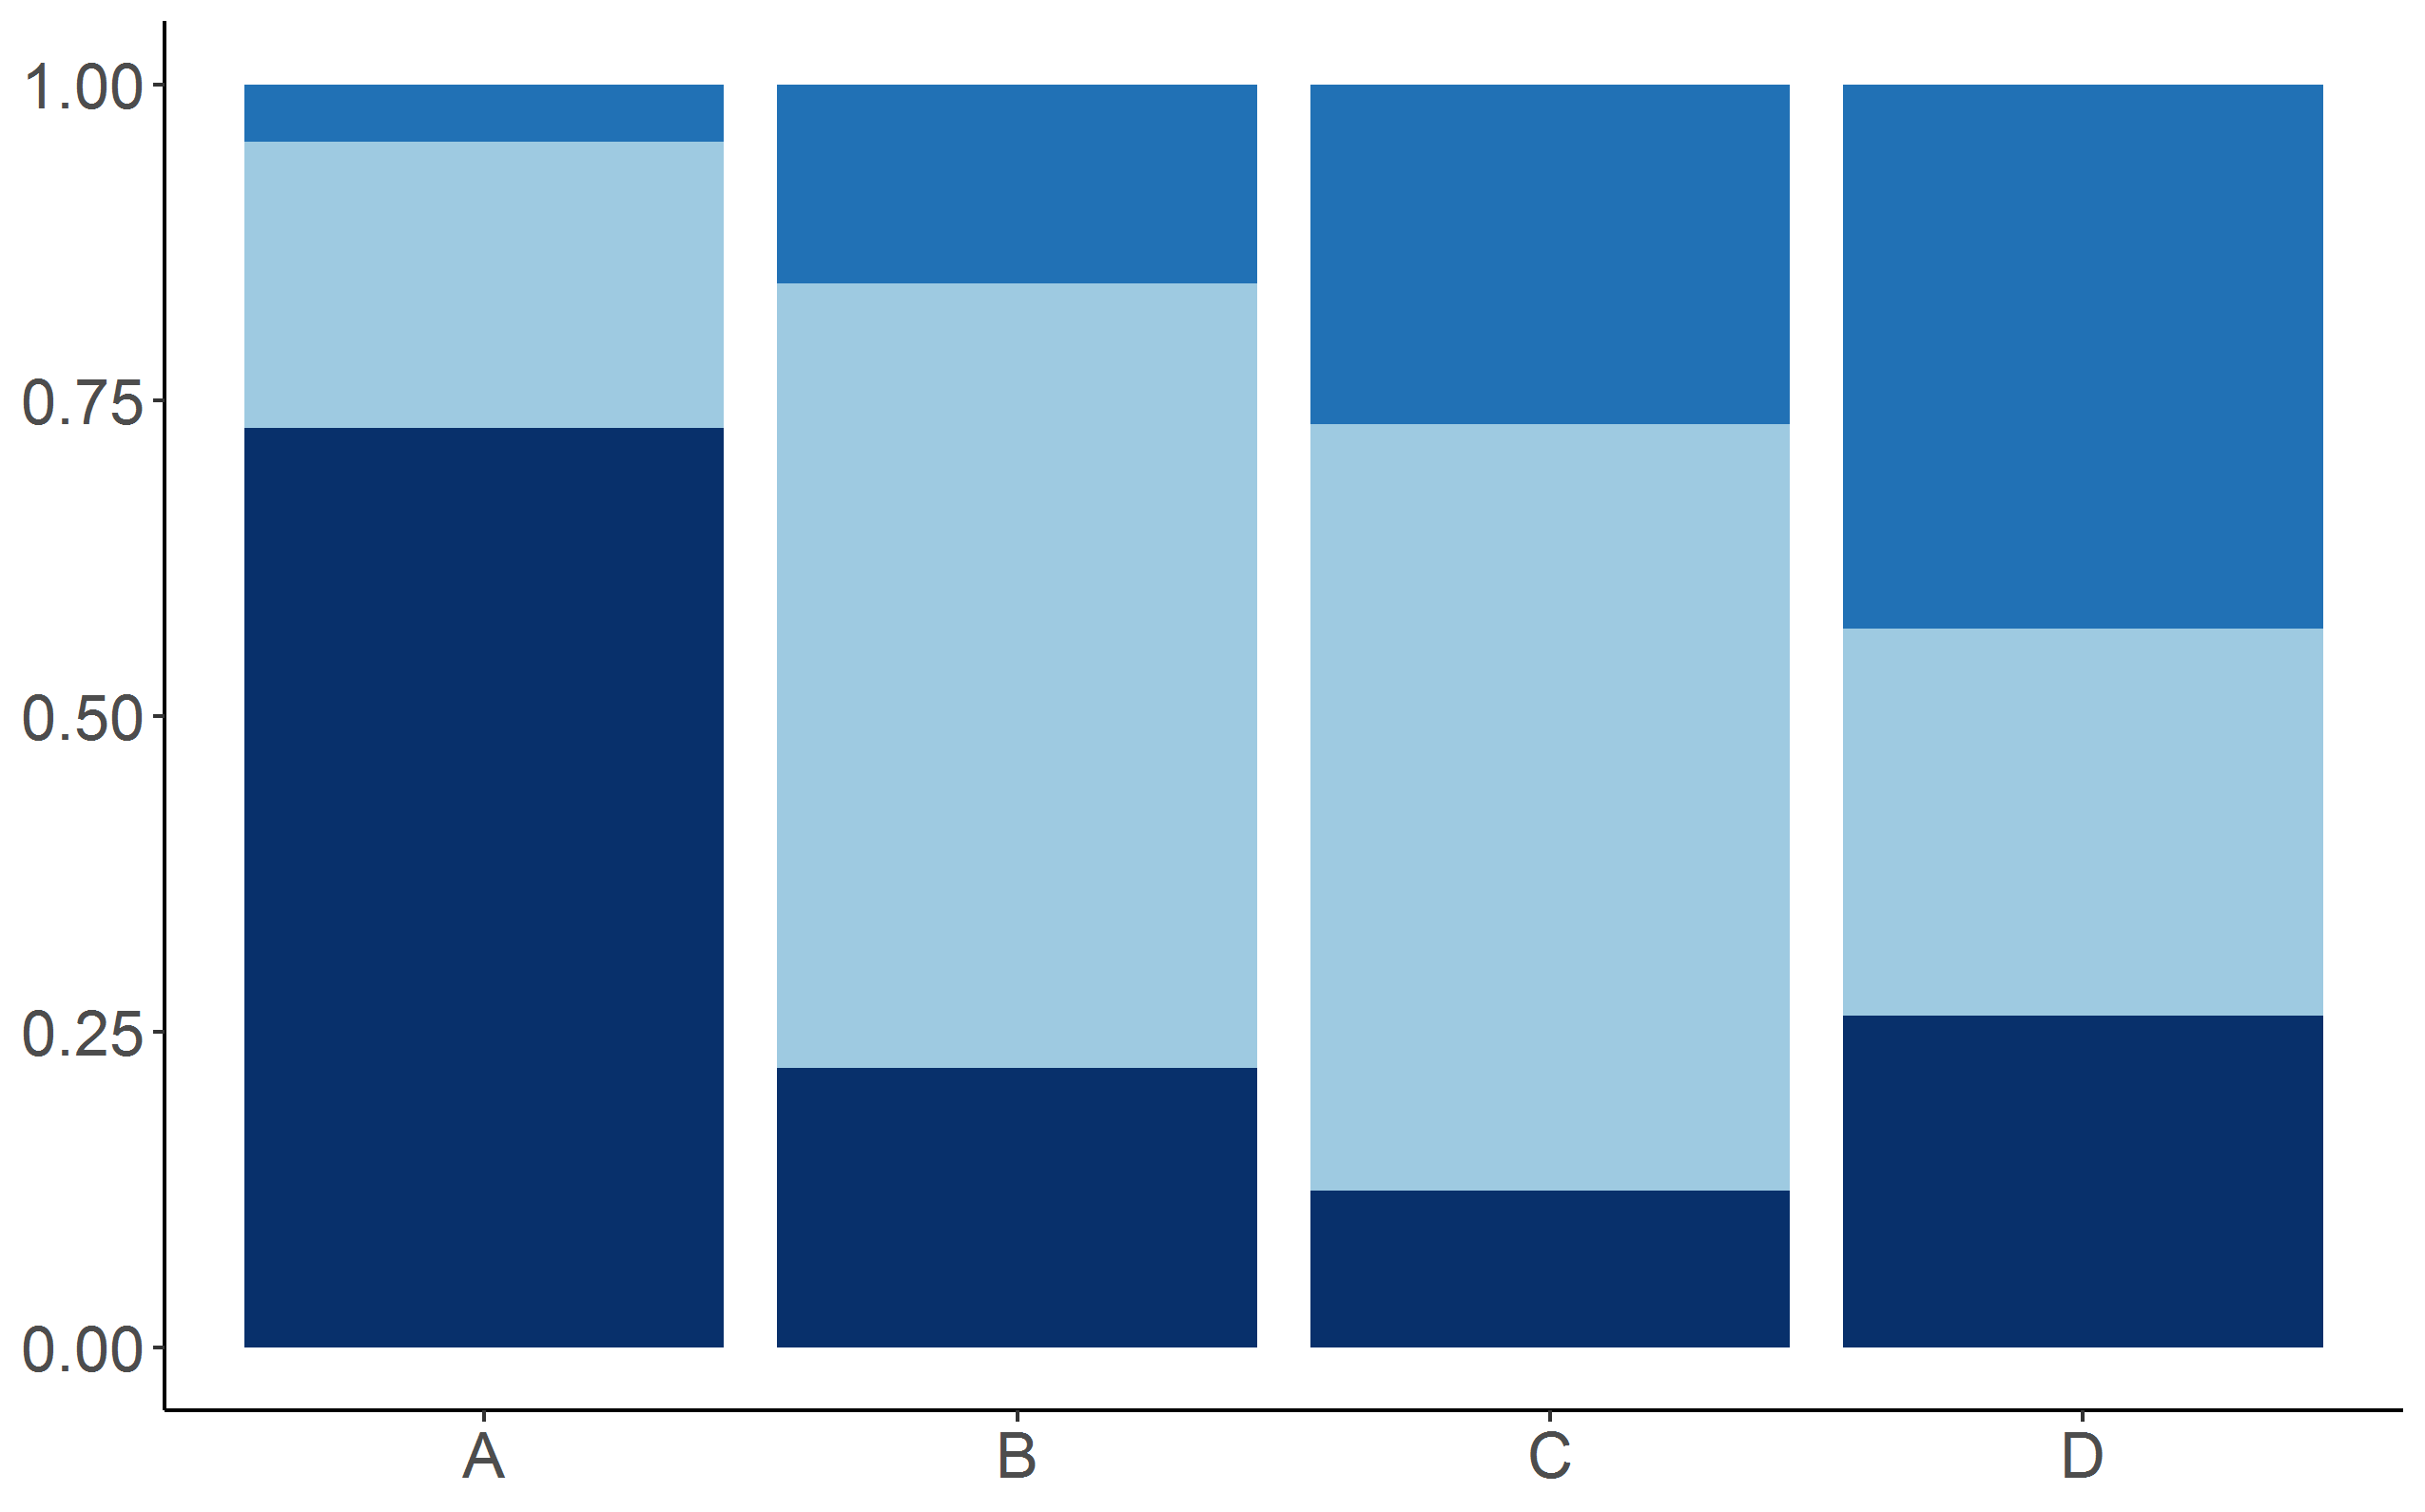
It is designed to display the relationship of constituent parts to the whole to compare the contribution of each value to a total across categories. The range of x-axis values is from 0 to 100%.
It is designed to display the relationship of constituent parts to the whole to compare the contribution of each value to a total across categories. The range of x-axis values is from 0 to 100%.