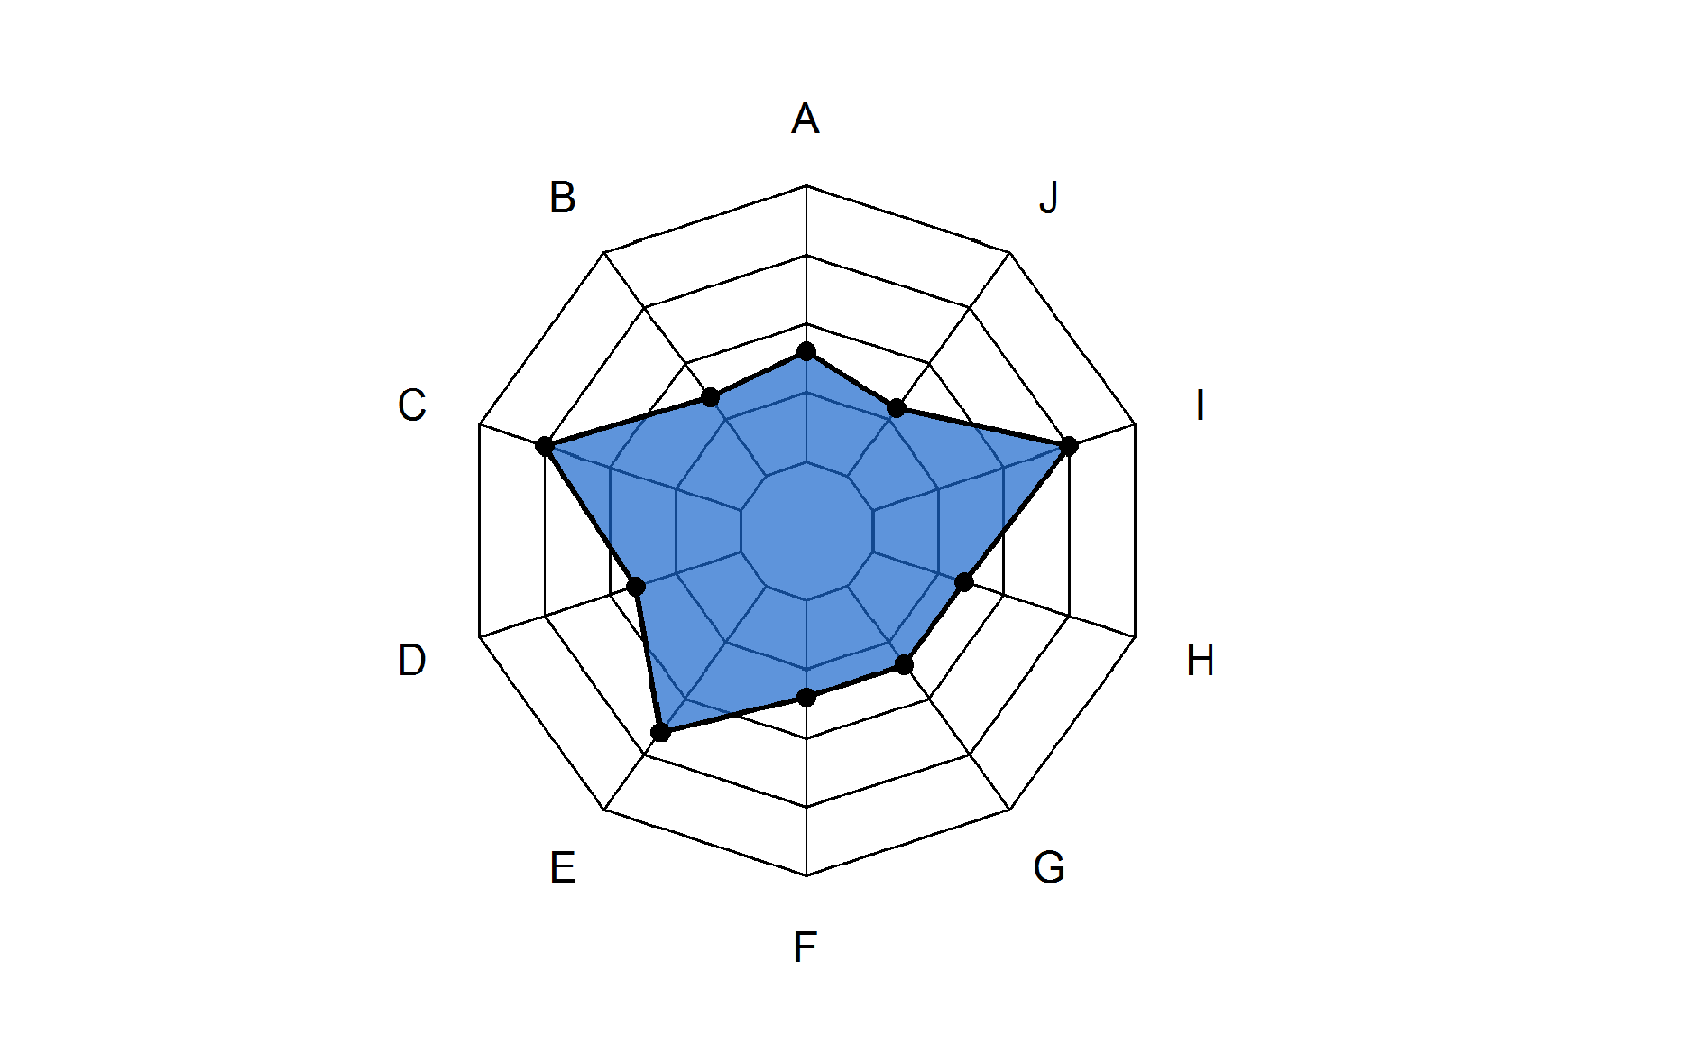
Radar Chart
It displays multivariate data in the form of a 2D graph of three or more quantitative variables represented on axes starting from the same point.

It displays multivariate data in the form of a 2D graph of three or more quantitative variables represented on axes starting from the same point.
