Stacked Barplot
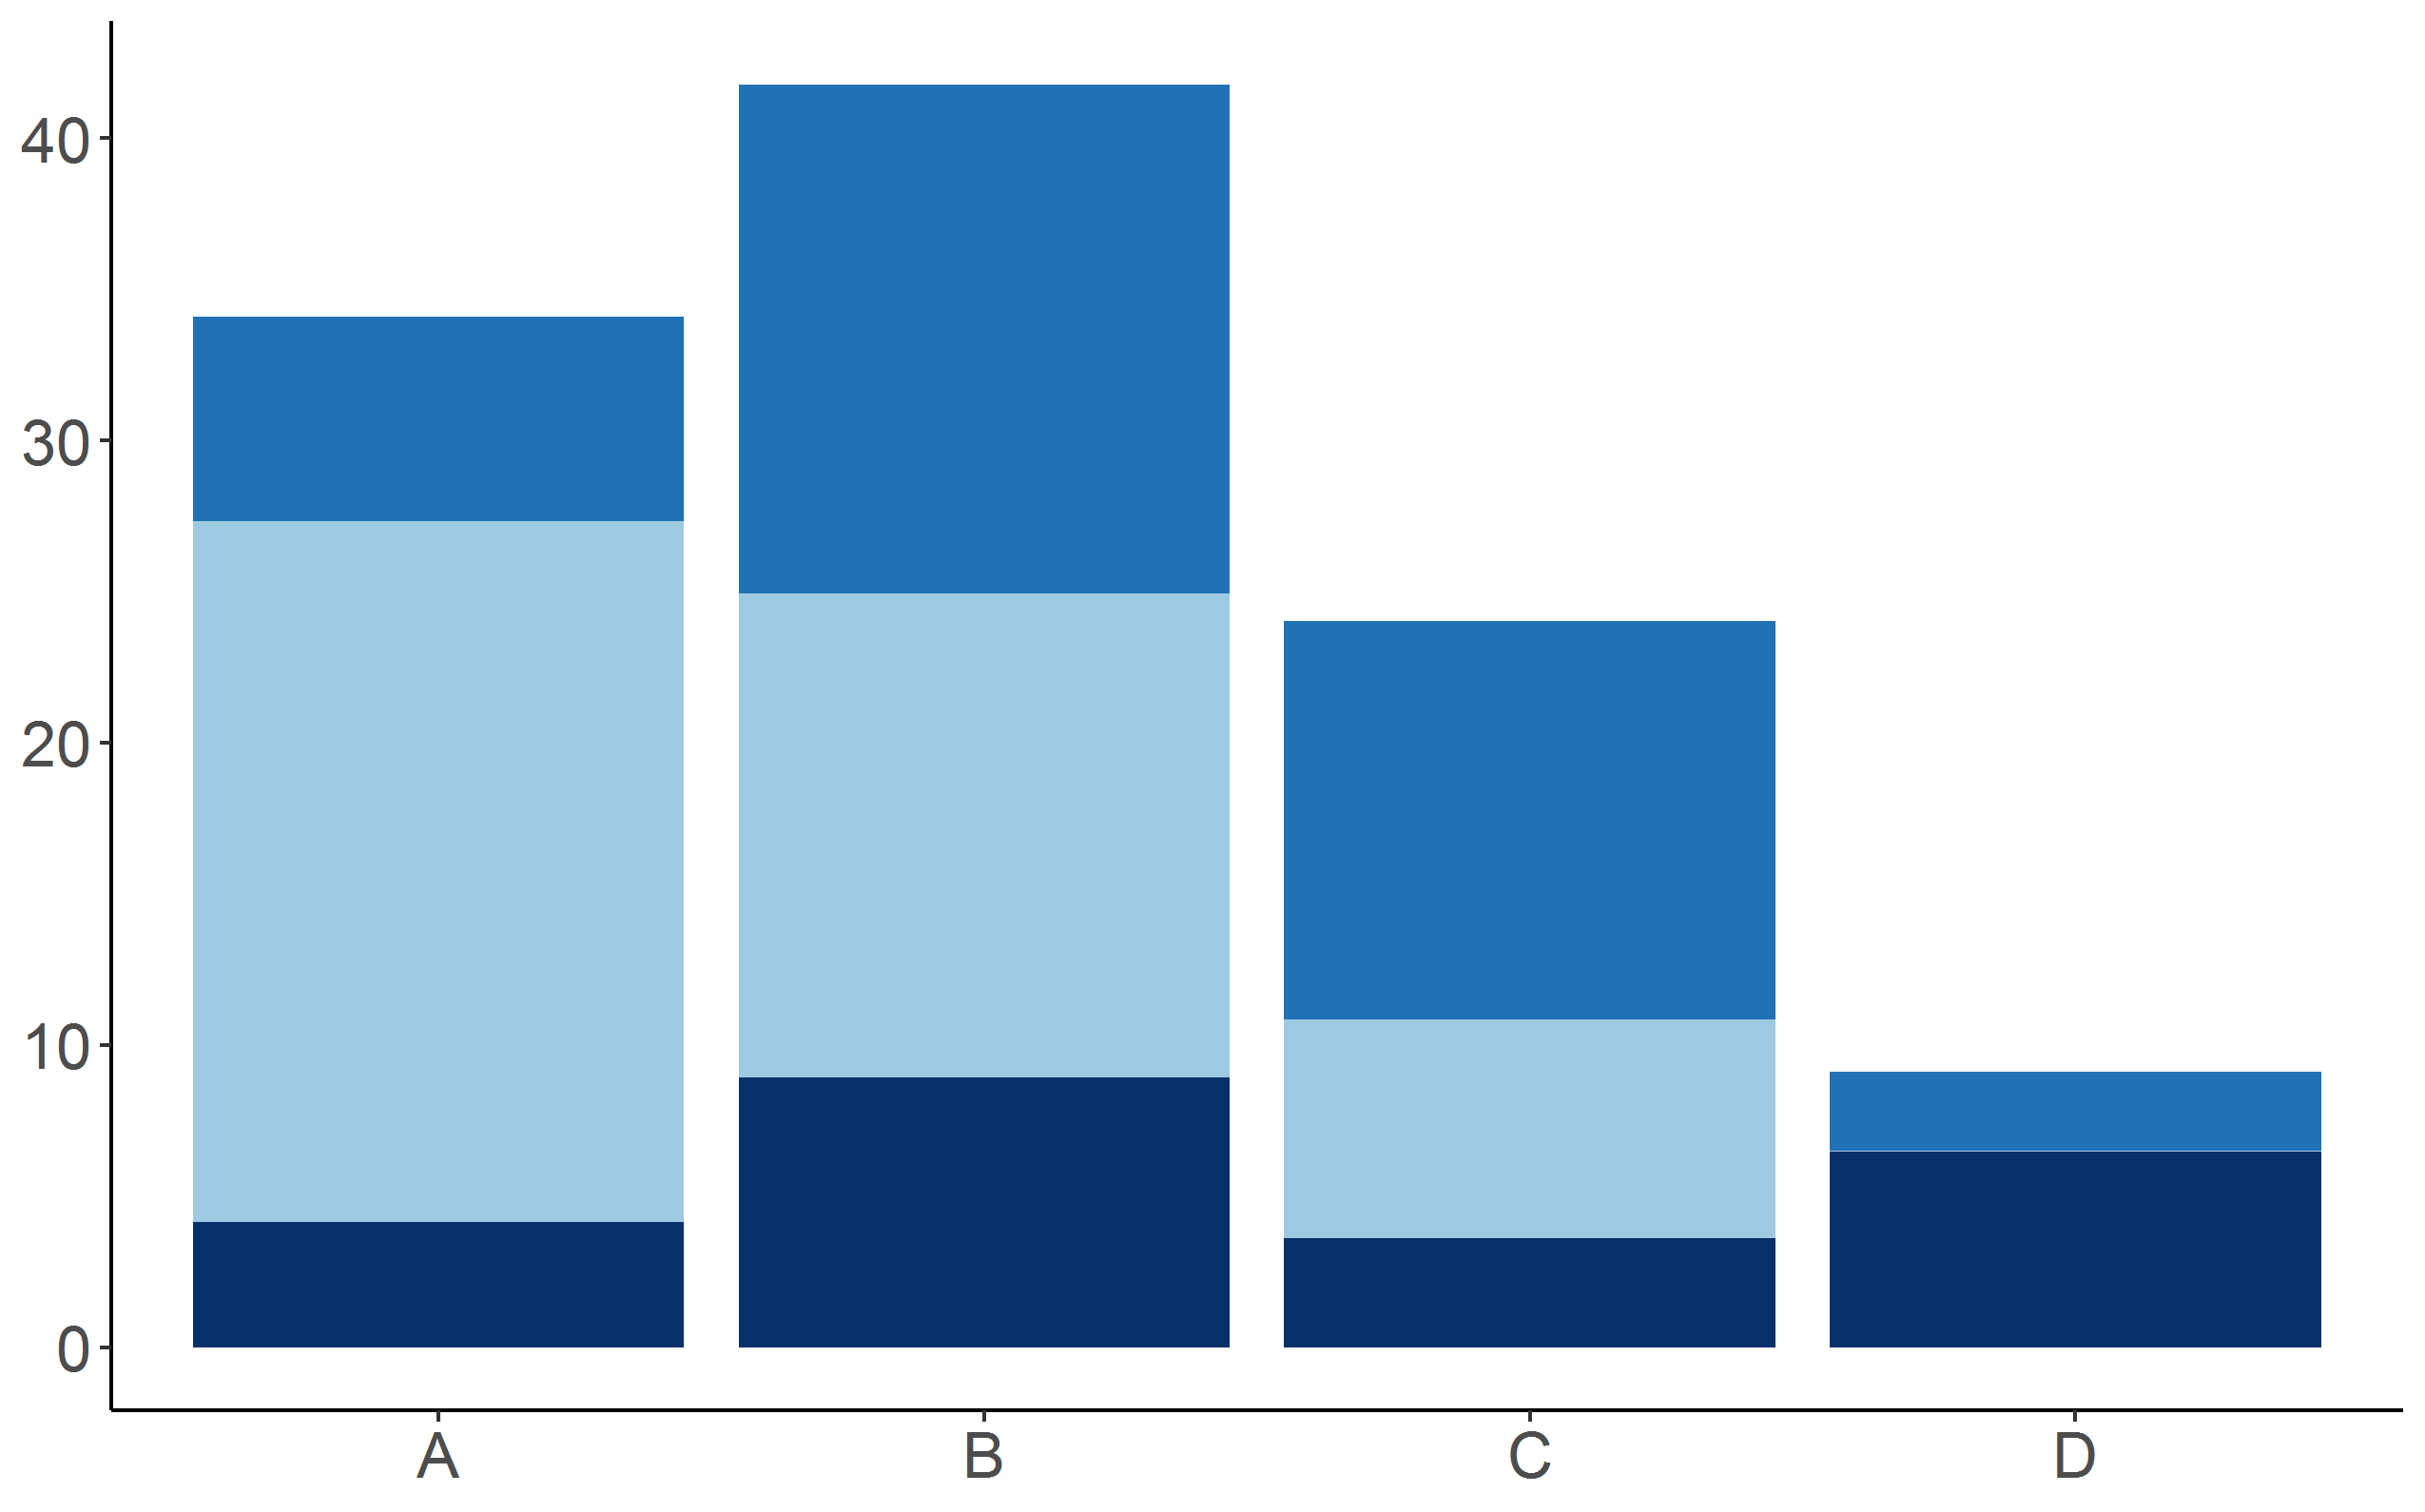
It displays quantities for different variables, stacked by another variable. It is like a grouped barplot but the frequency of the variables are stacked.

It displays quantities for different variables, stacked by another variable. It is like a grouped barplot but the frequency of the variables are stacked.
