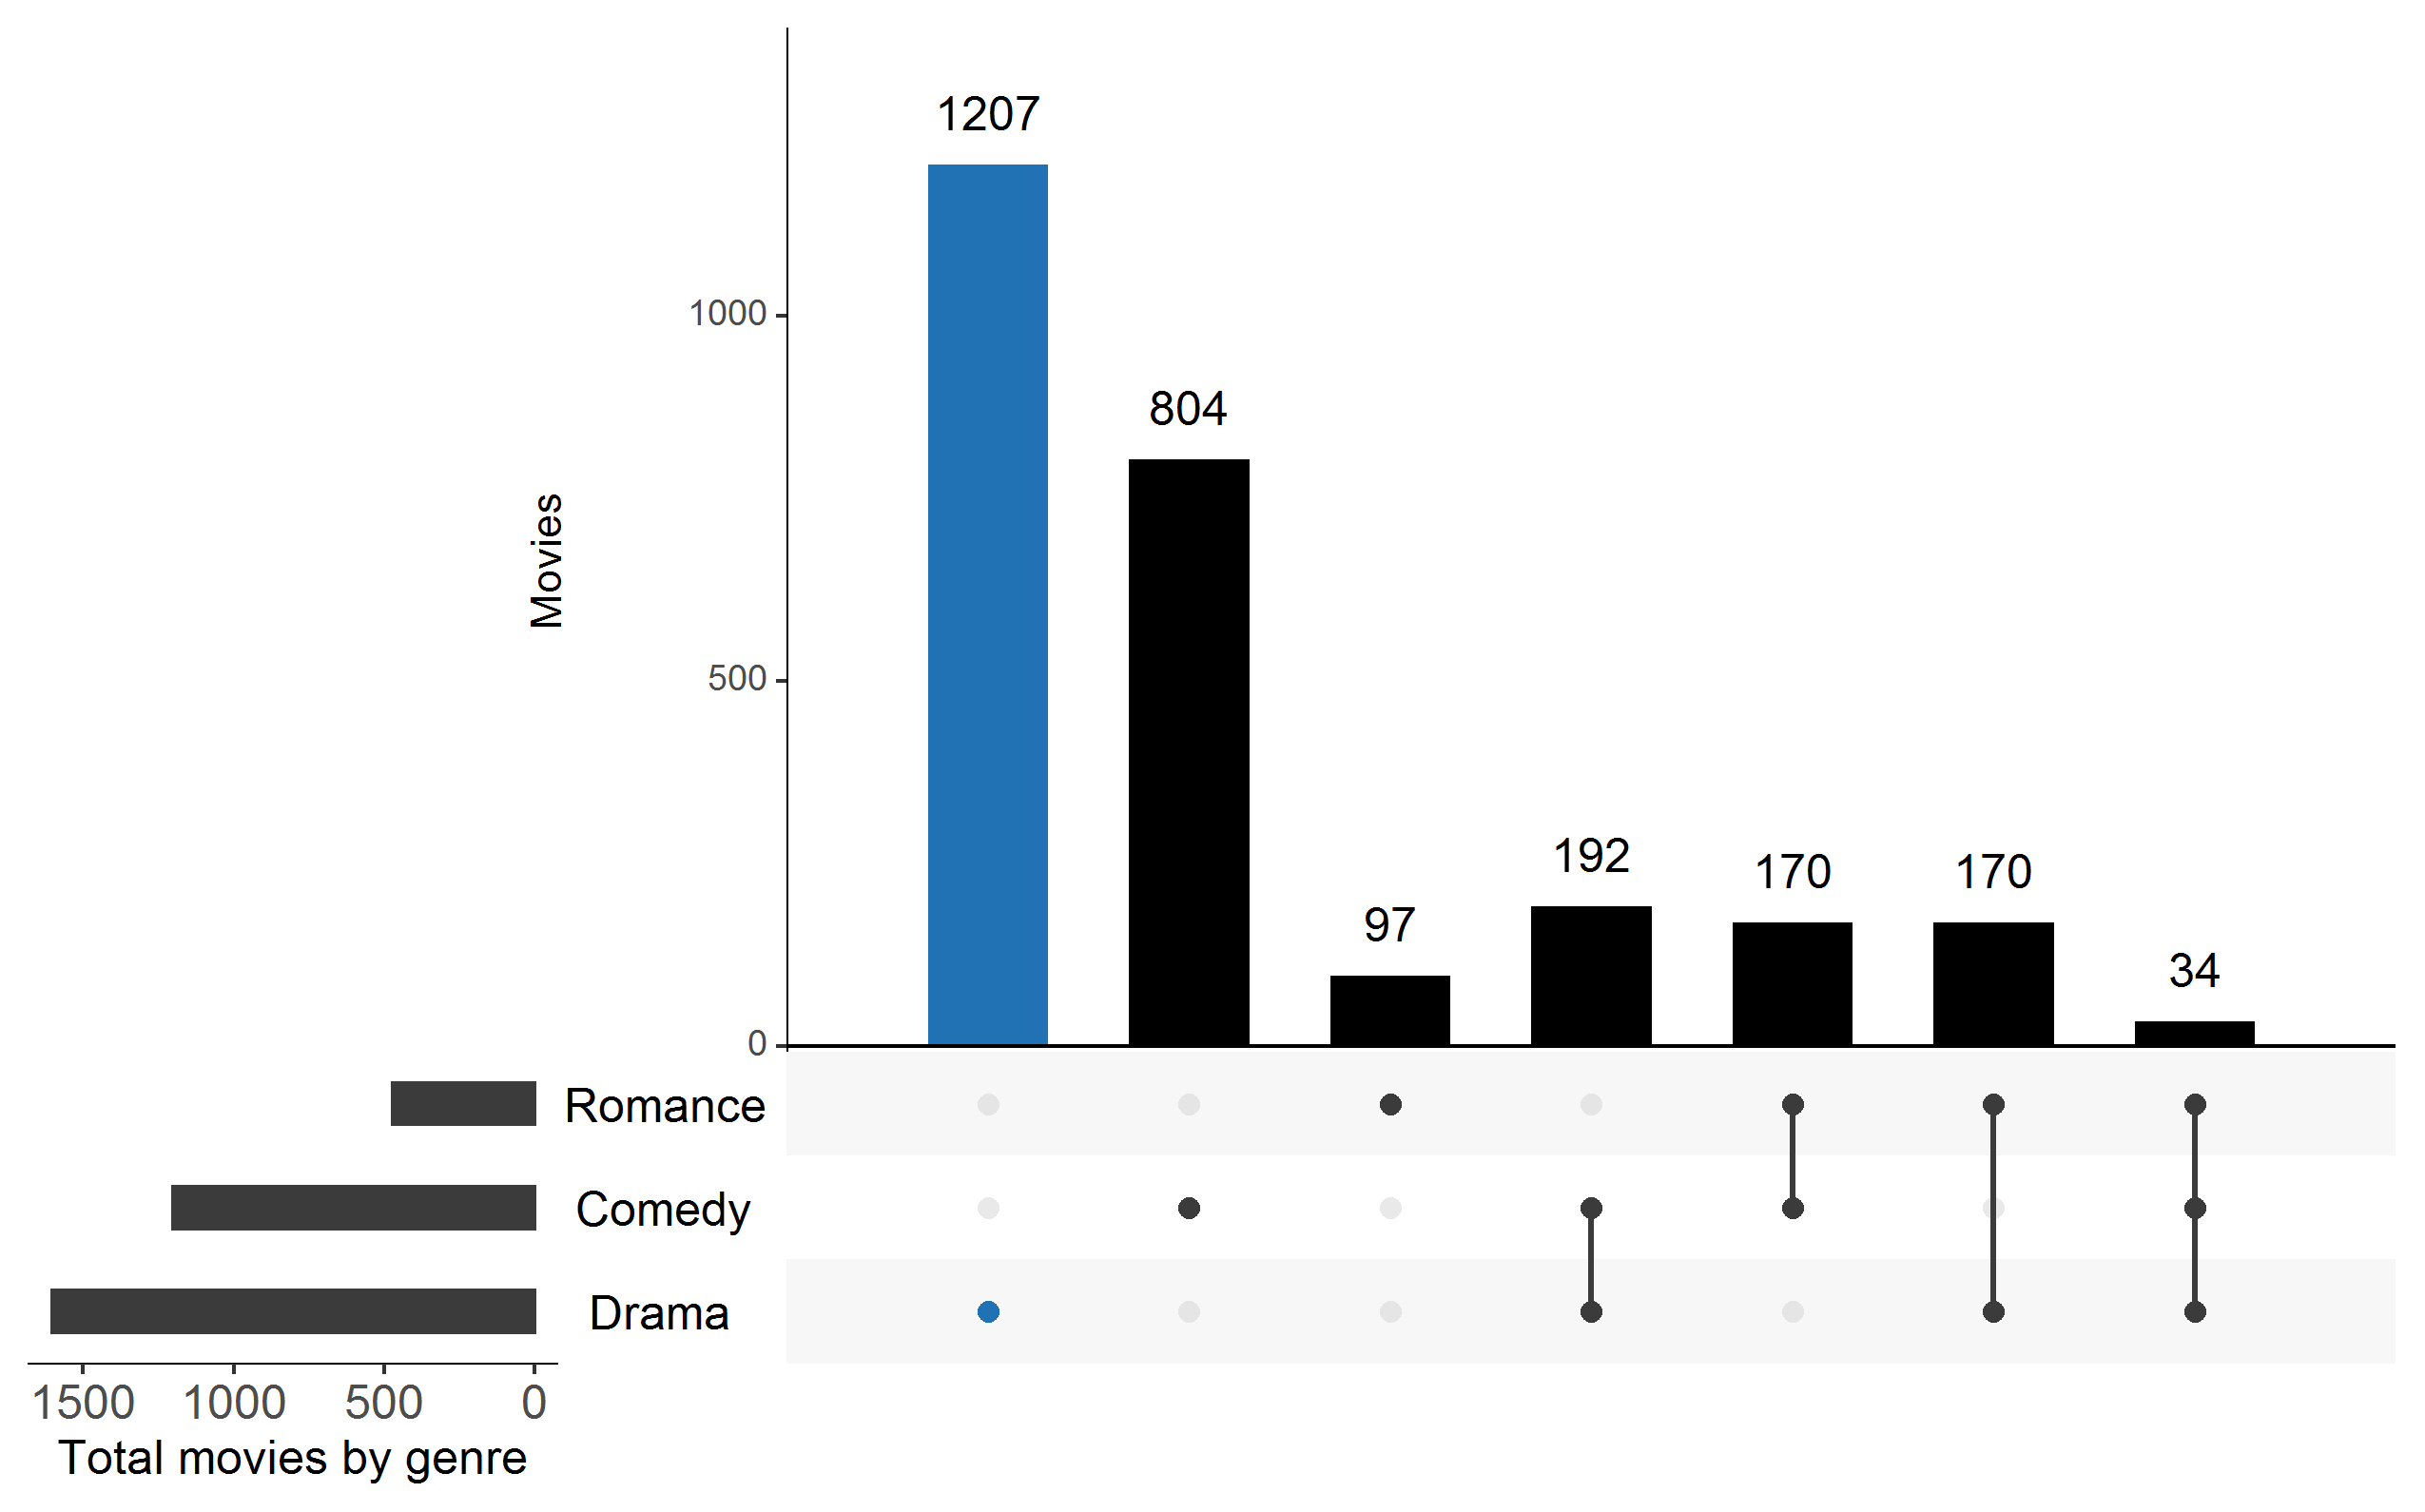
Upset Diagram
It is used to understand relationships among sets. Each column corresponds to a set and bars on top show the set size. Each row corresponds to a possible intersection: the filled circles show which set is part of an intersection.

It is used to understand relationships among sets. Each column corresponds to a set and bars on top show the set size. Each row corresponds to a possible intersection: the filled circles show which set is part of an intersection.
