Violin Plot
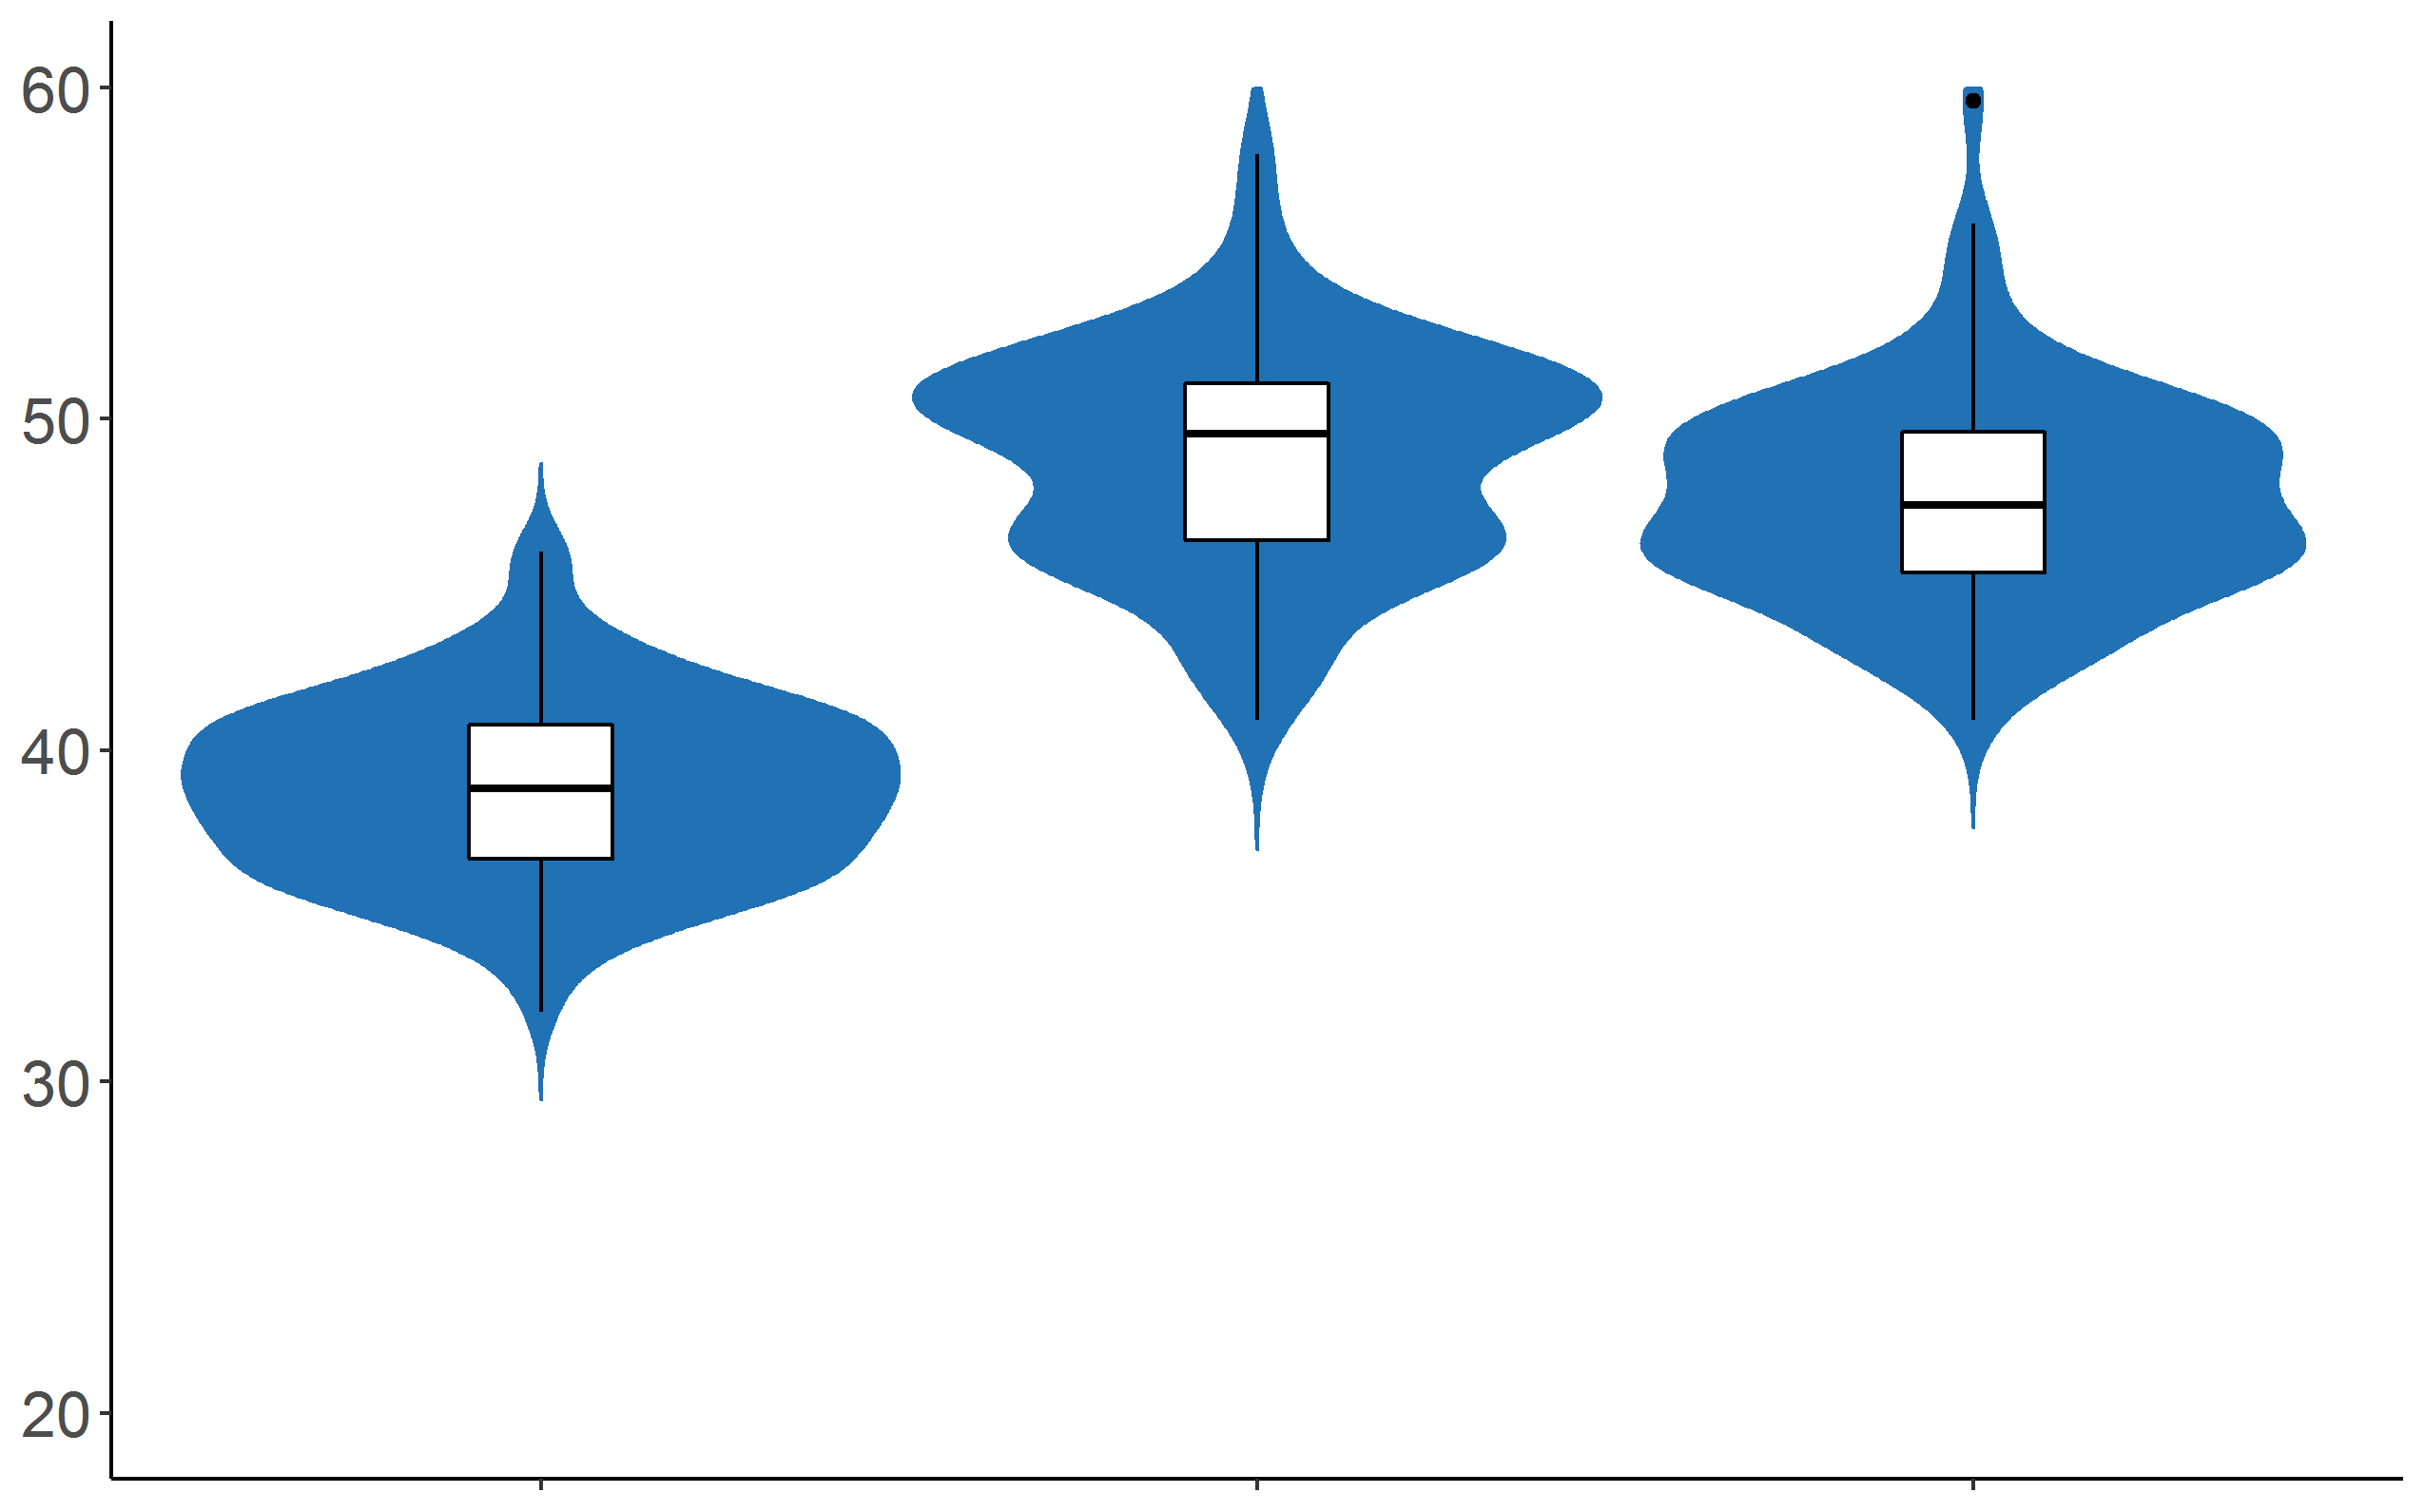
It depicts distributions of numeric data for one or more groups using density curves. It is similar to a box plot with the addition of a rotated kernel density plot on each side.
It depicts distributions of numeric data for one or more groups using density curves. It is similar to a box plot with the addition of a rotated kernel density plot on each side.