dataviz-cheatsheet
Data Viz cheatsheet
Overview
This is a repo that aims to provide a variety of charts with a simple R code to implement them. It is a cheatsheet for selecting the appropriate information for your dataset. Each type of chart comes with a sample dataset to test it first. The output plot is provided as a png file.
Link Here!
Code and Resources Used
R Version: 3.6.3
Packages: ggplot2, dplyr, tidyverse, wordcloud, ggpubr, fmsb, VennDiagram, corrplot, GGally, UpSetR, quantmod, plotly, treemapify, densityridges, circlize
*Click on the chart type to access the repo and on the chart image to access the code
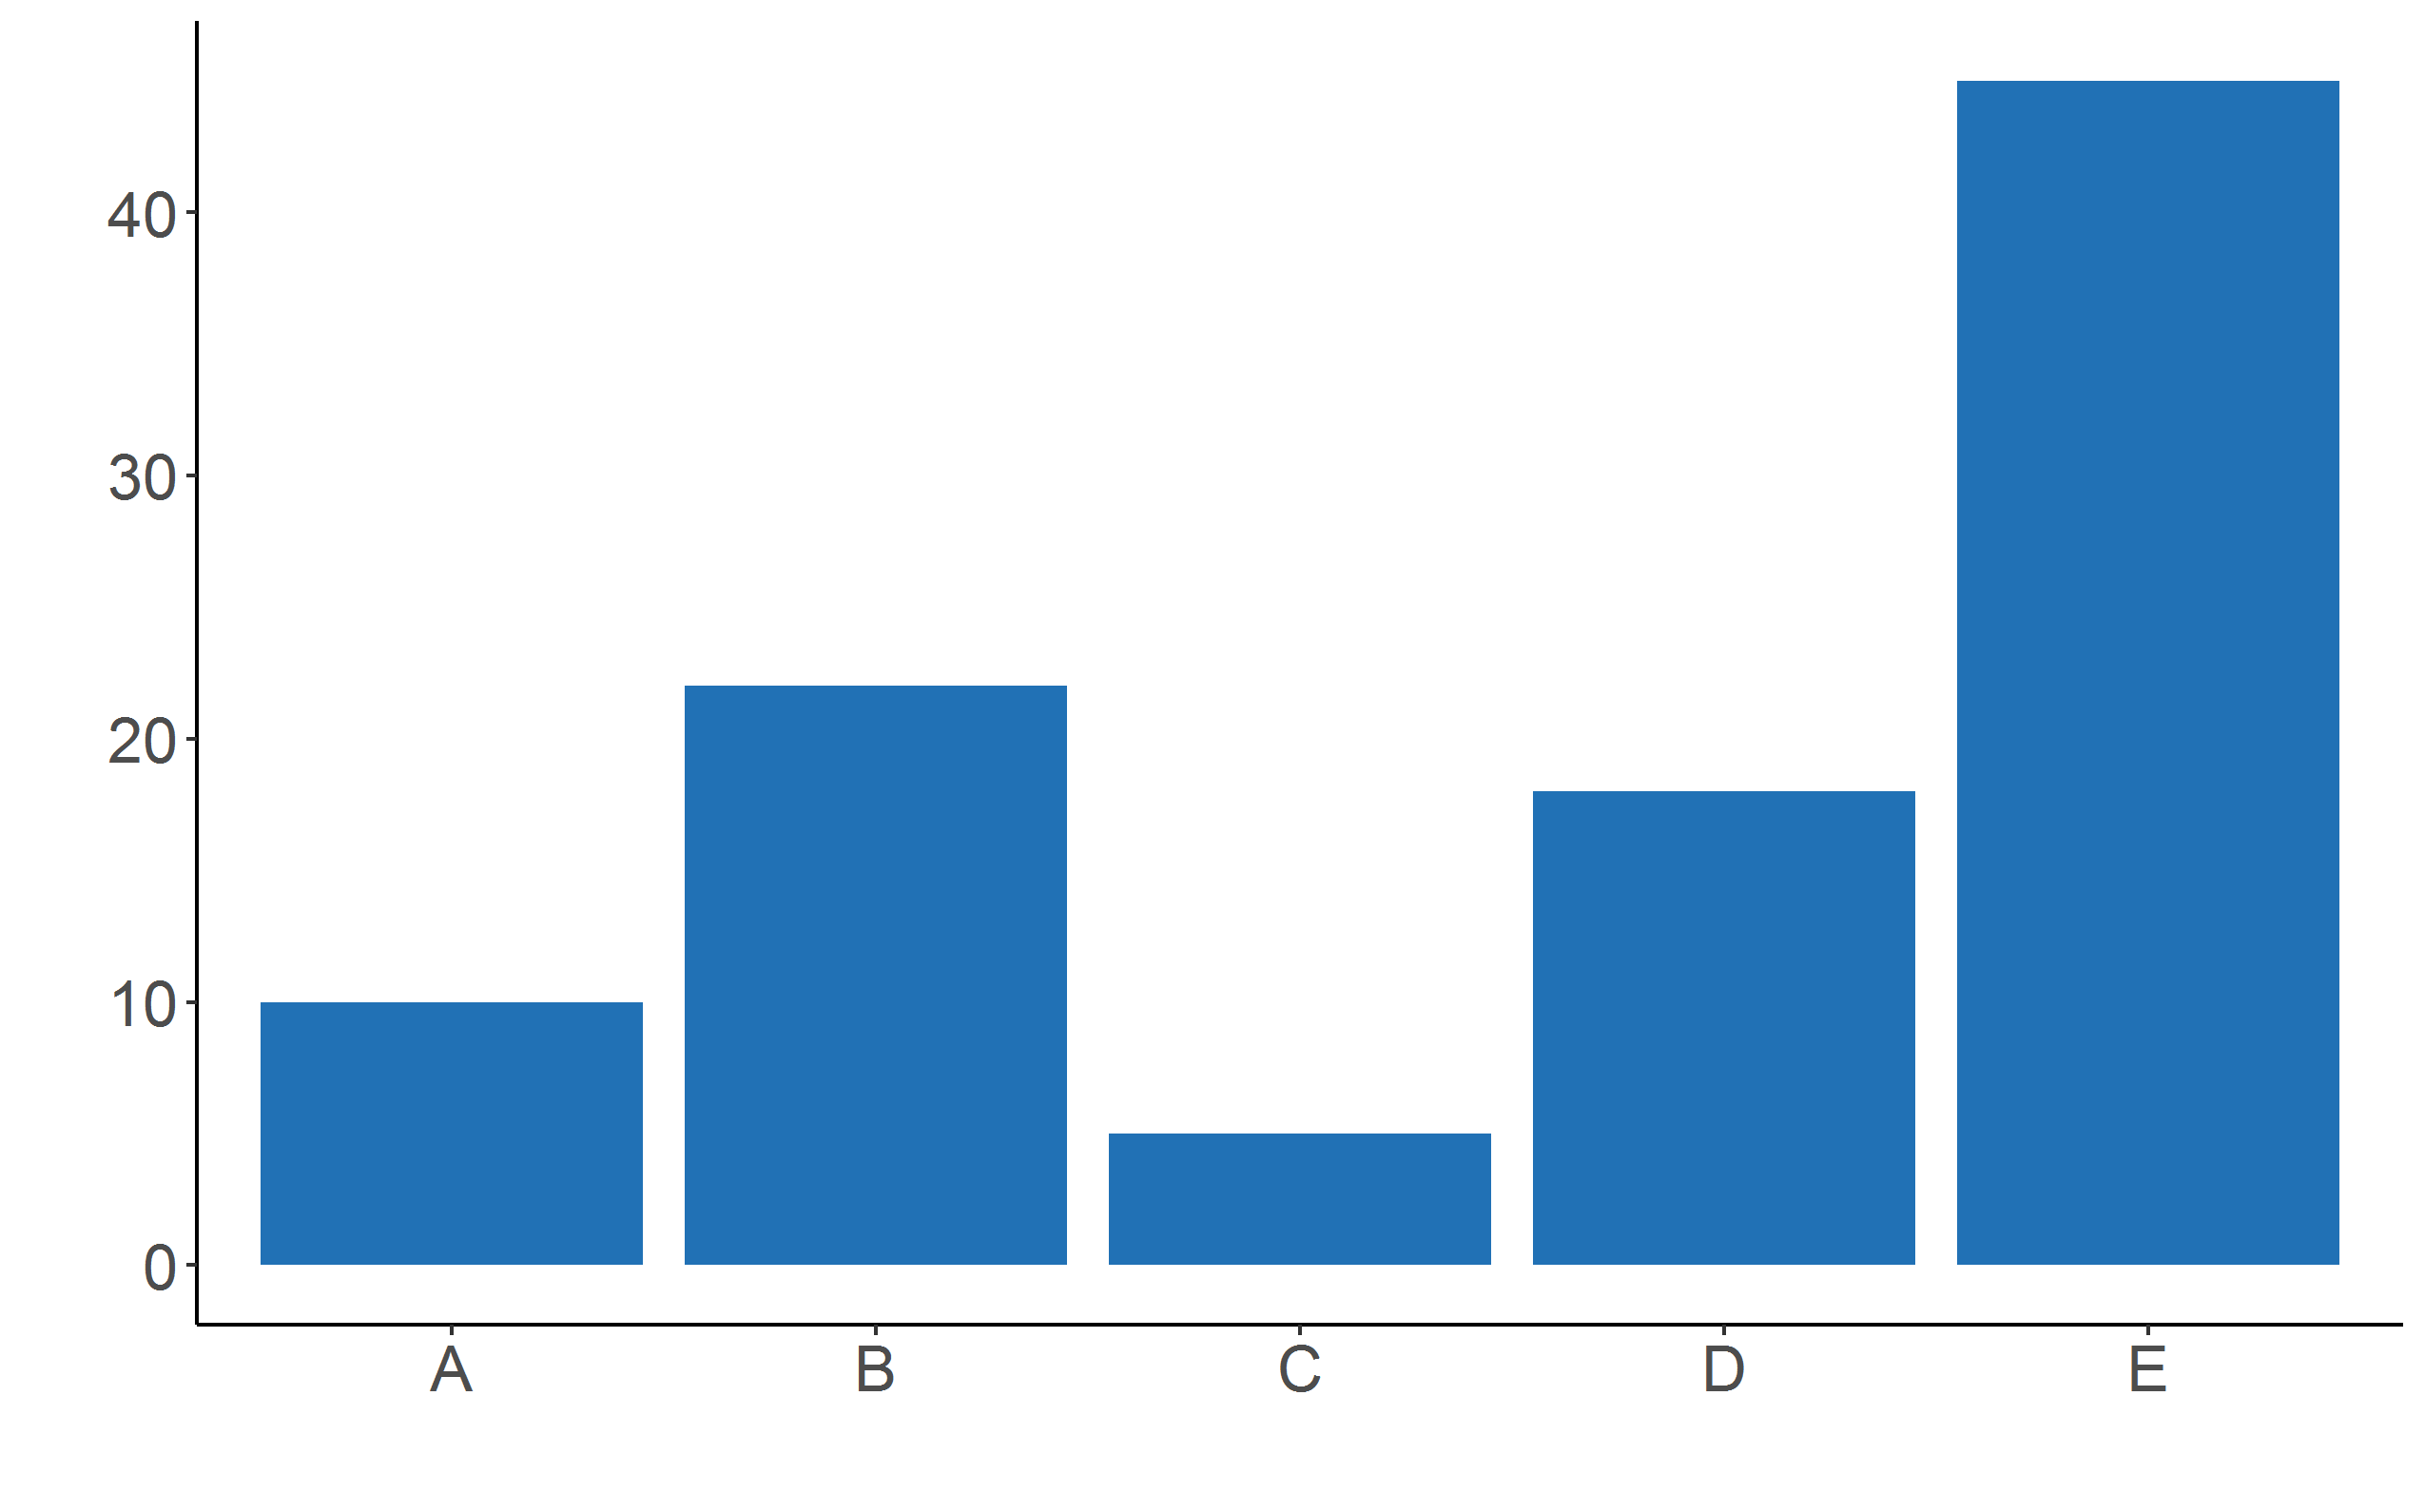
Barplot
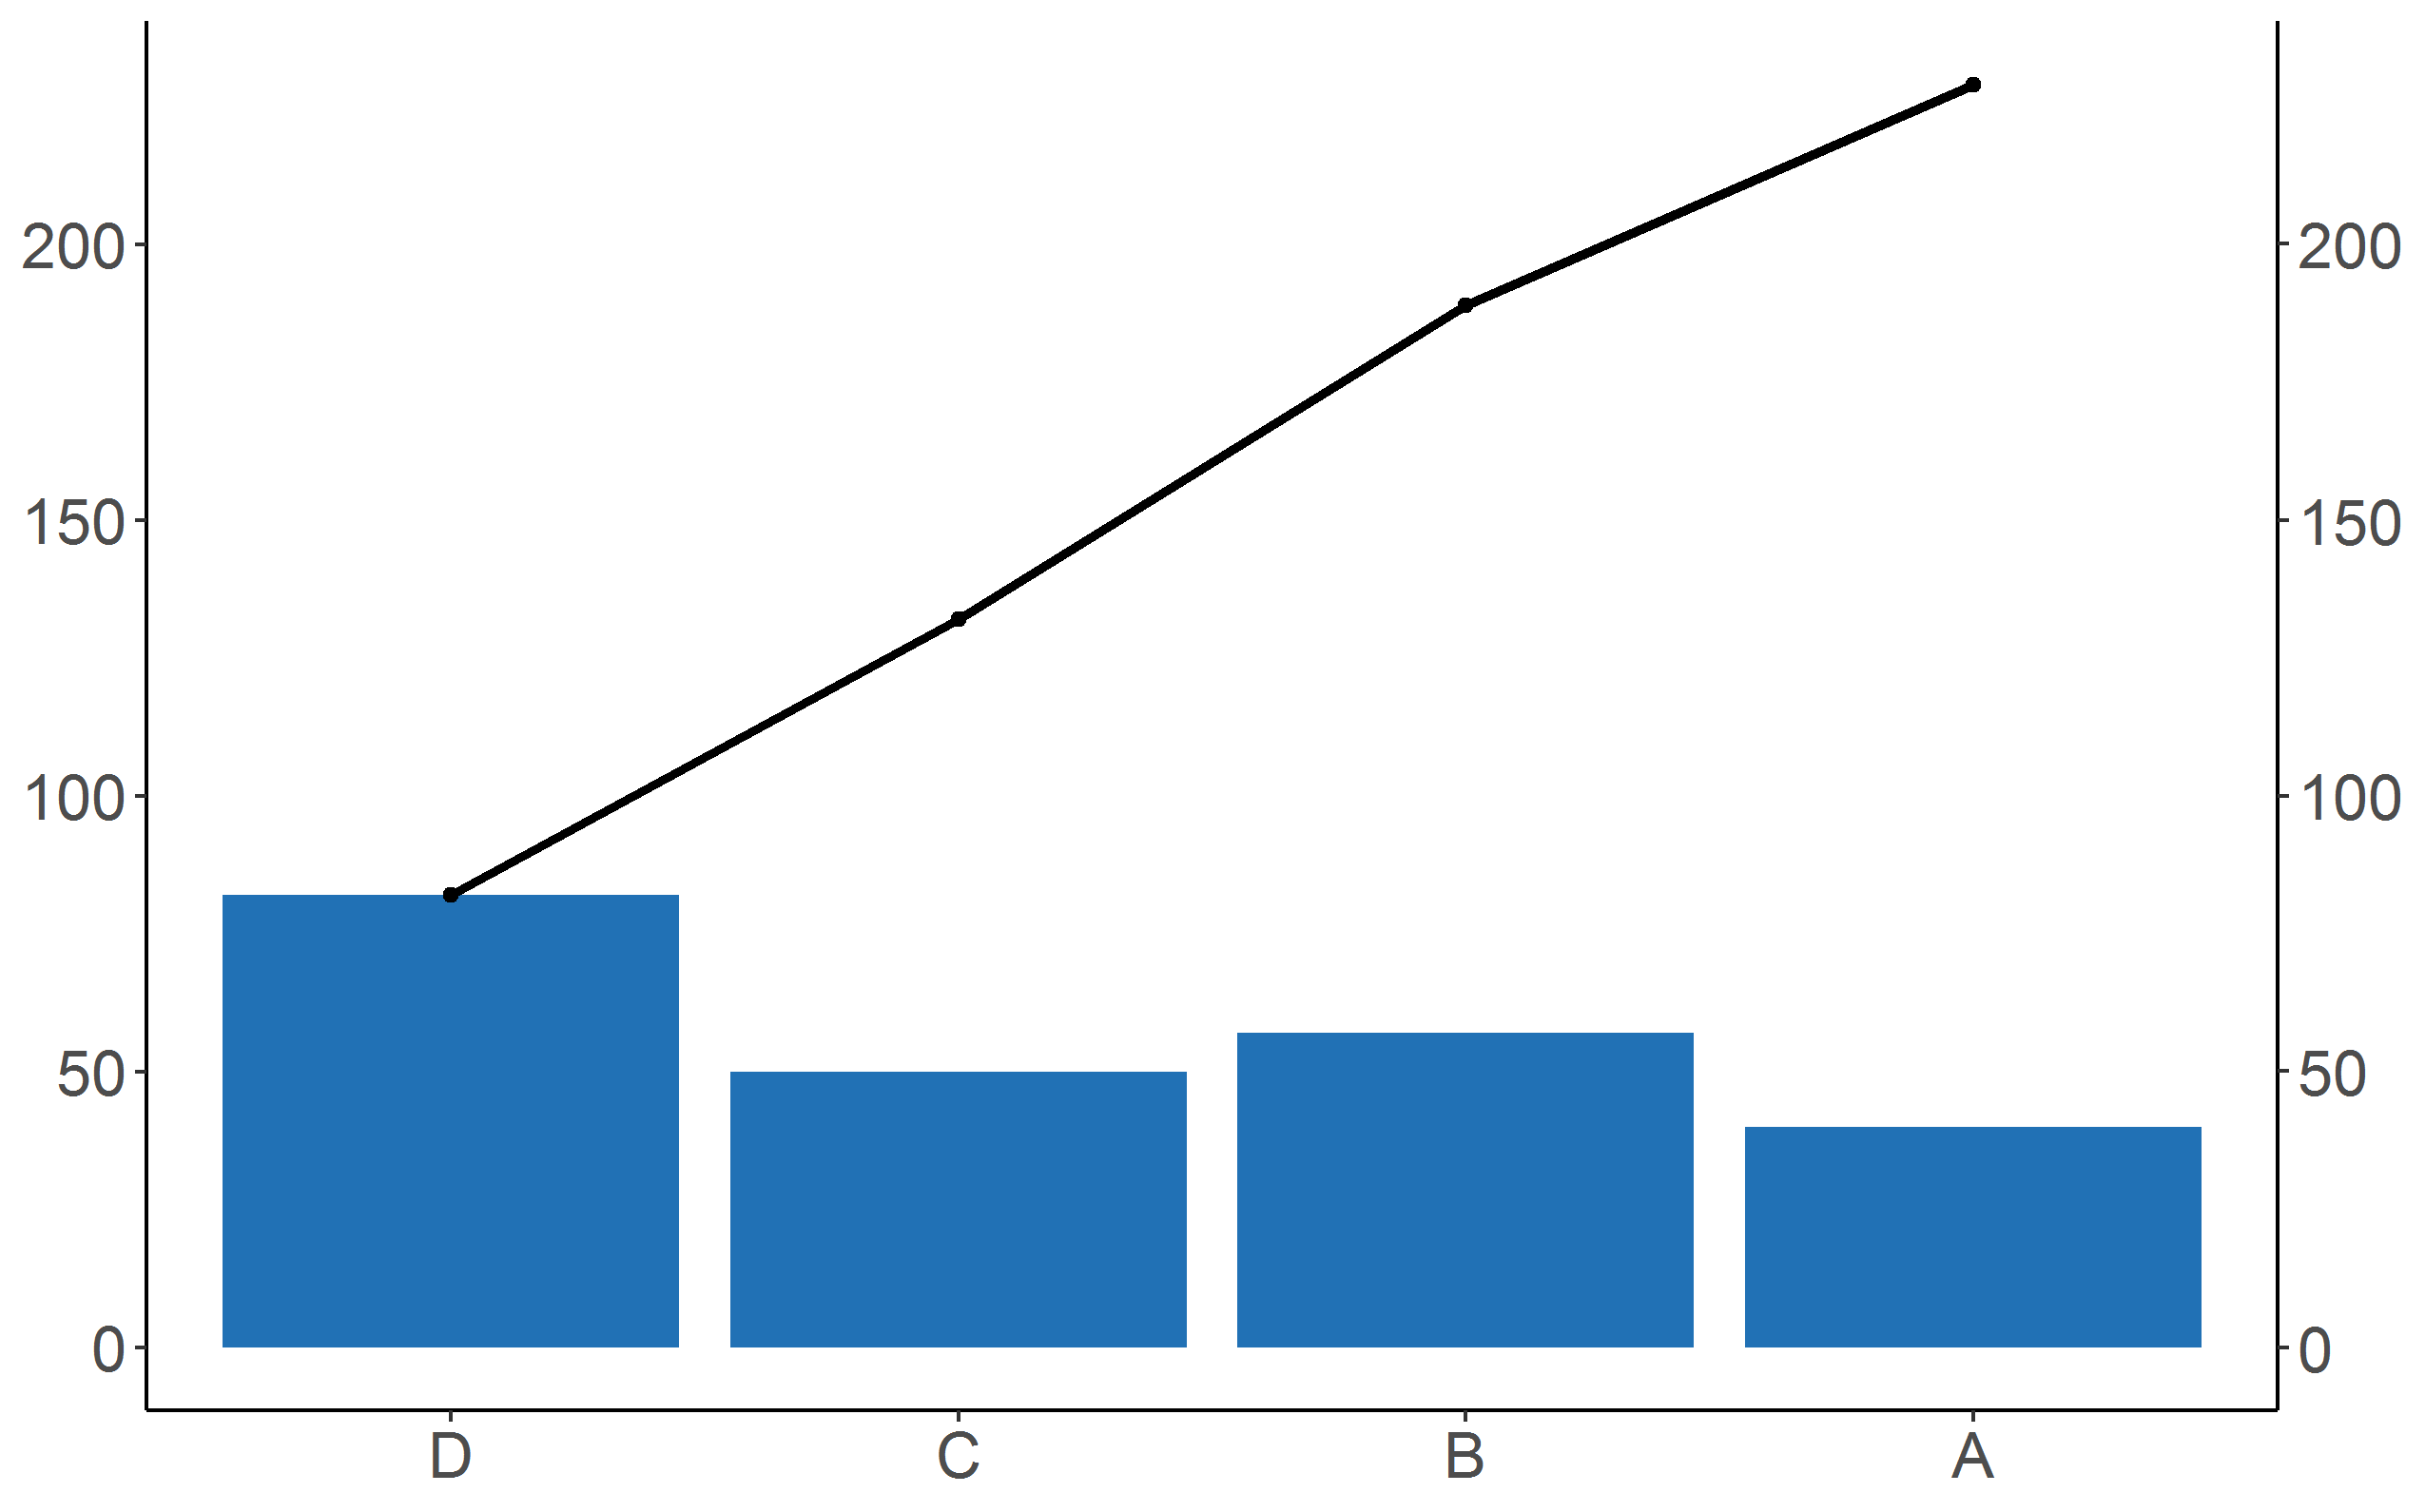
Pareto plot
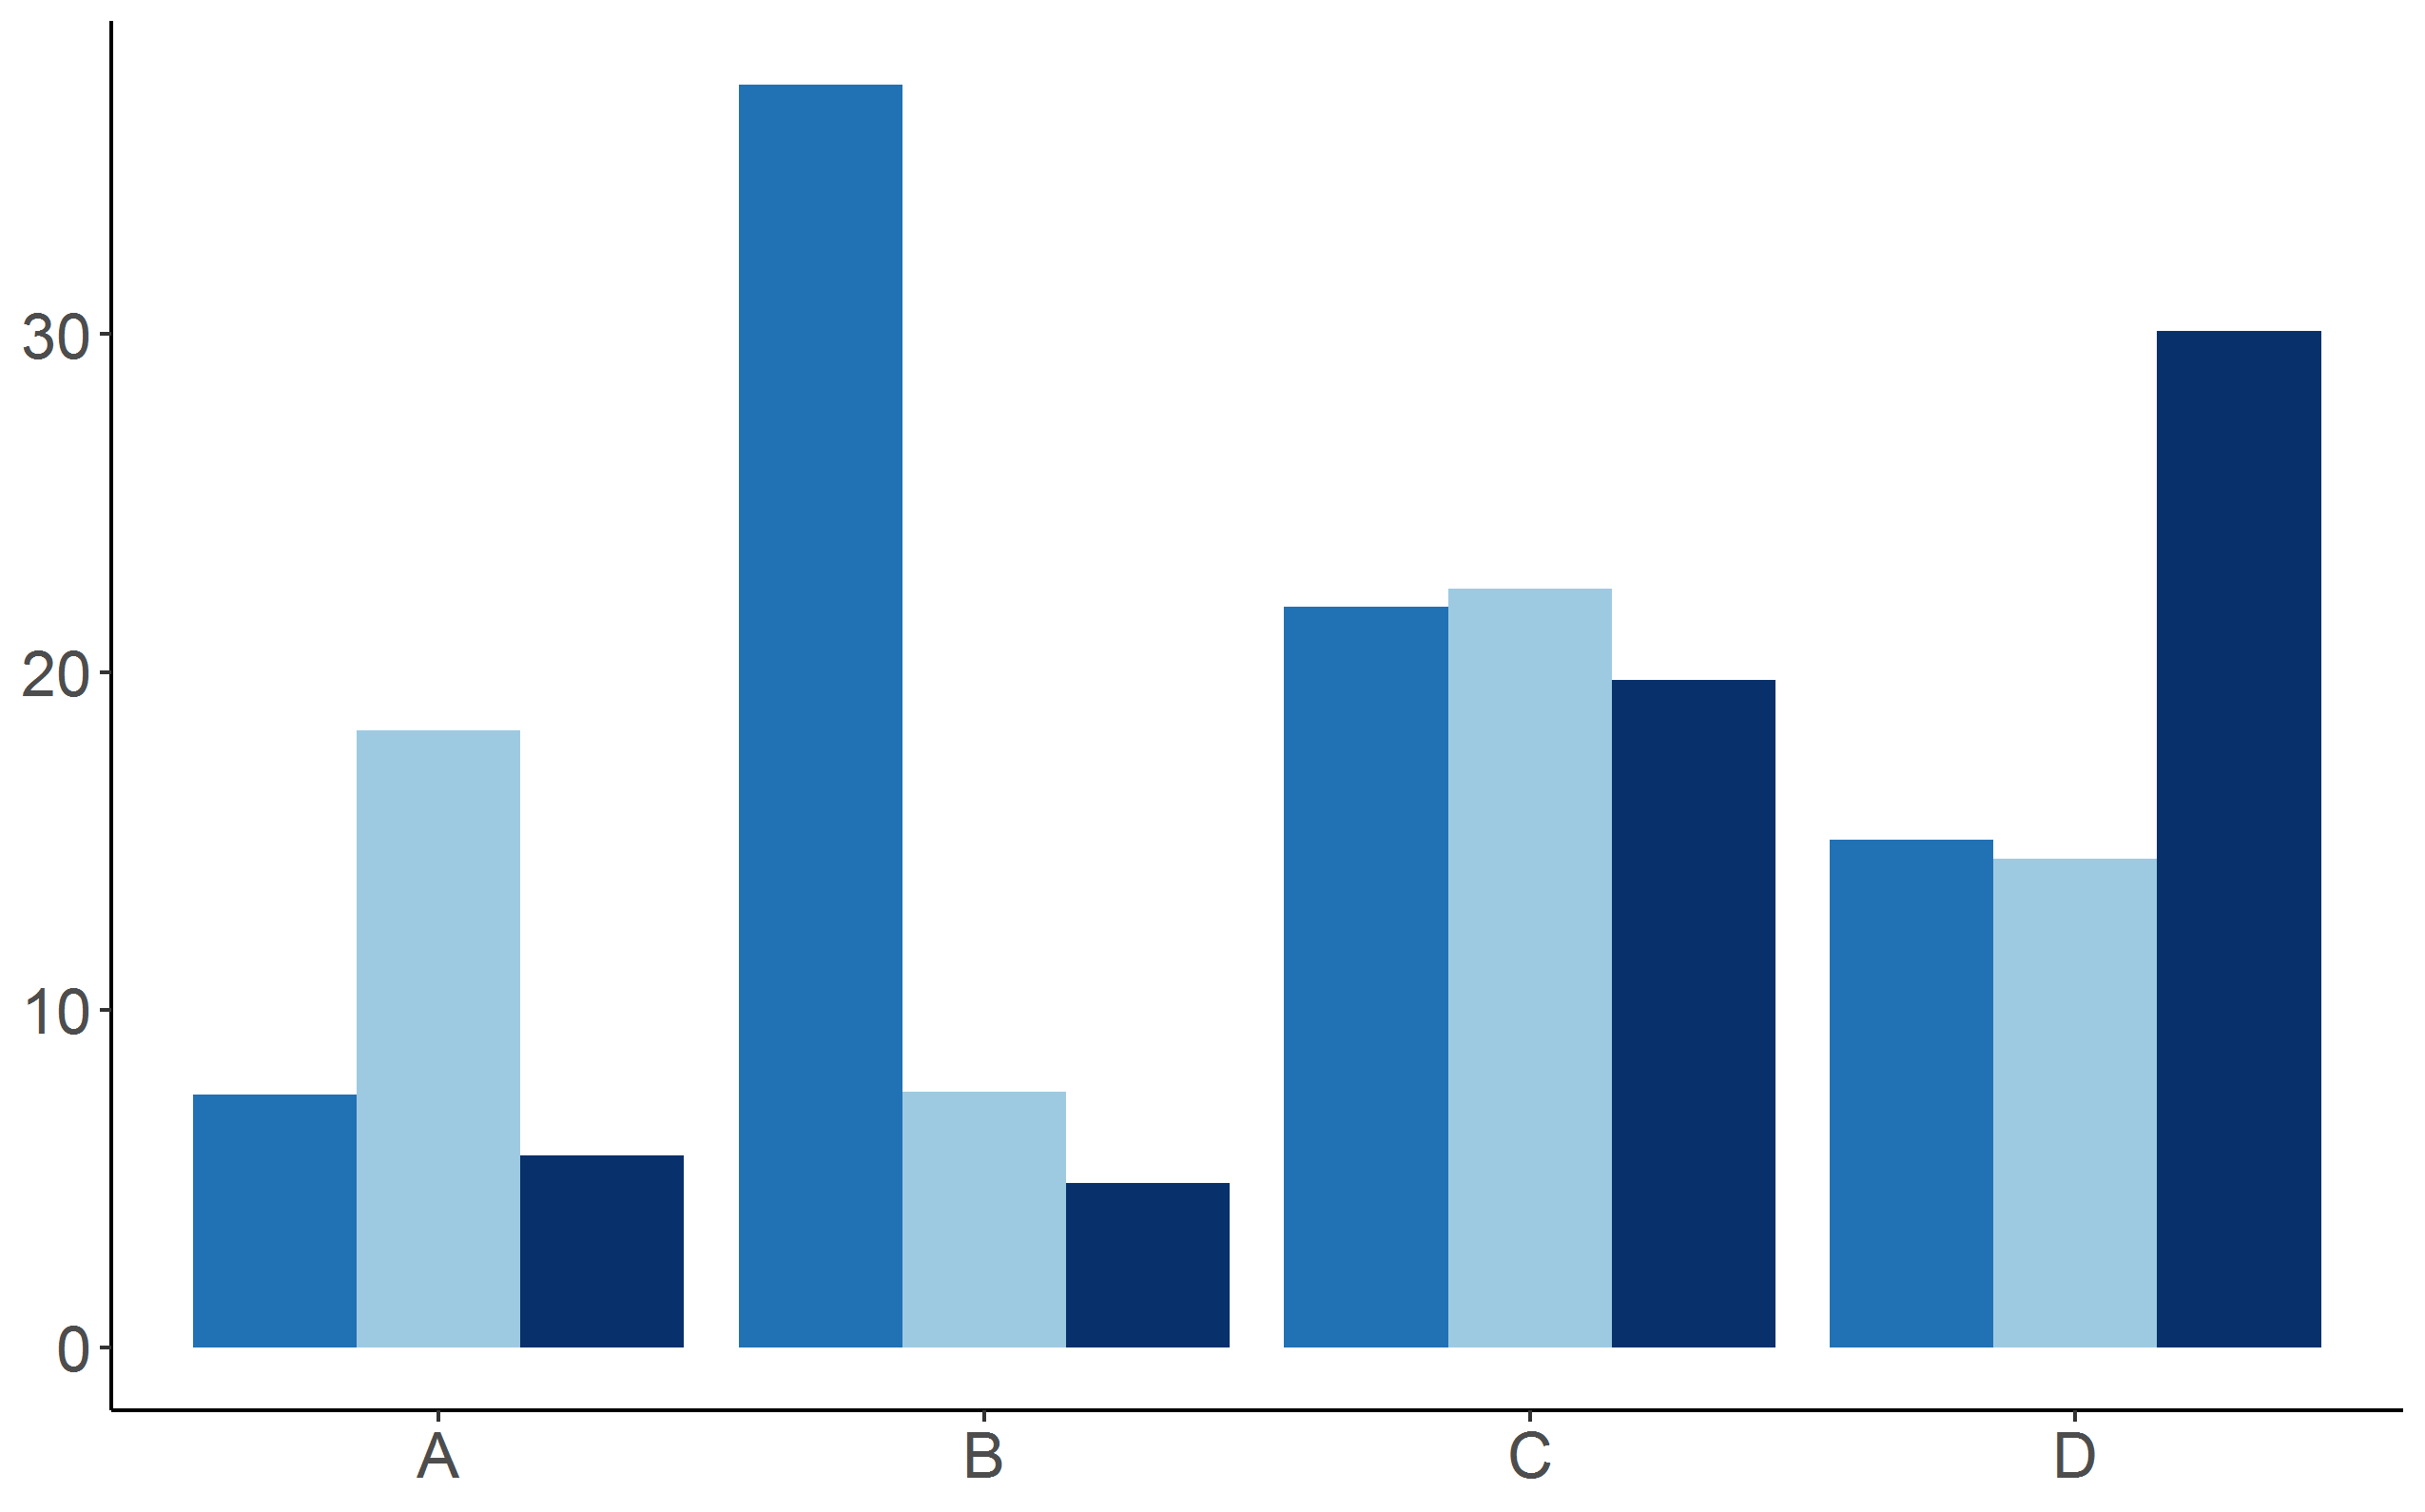
Grouped barplot
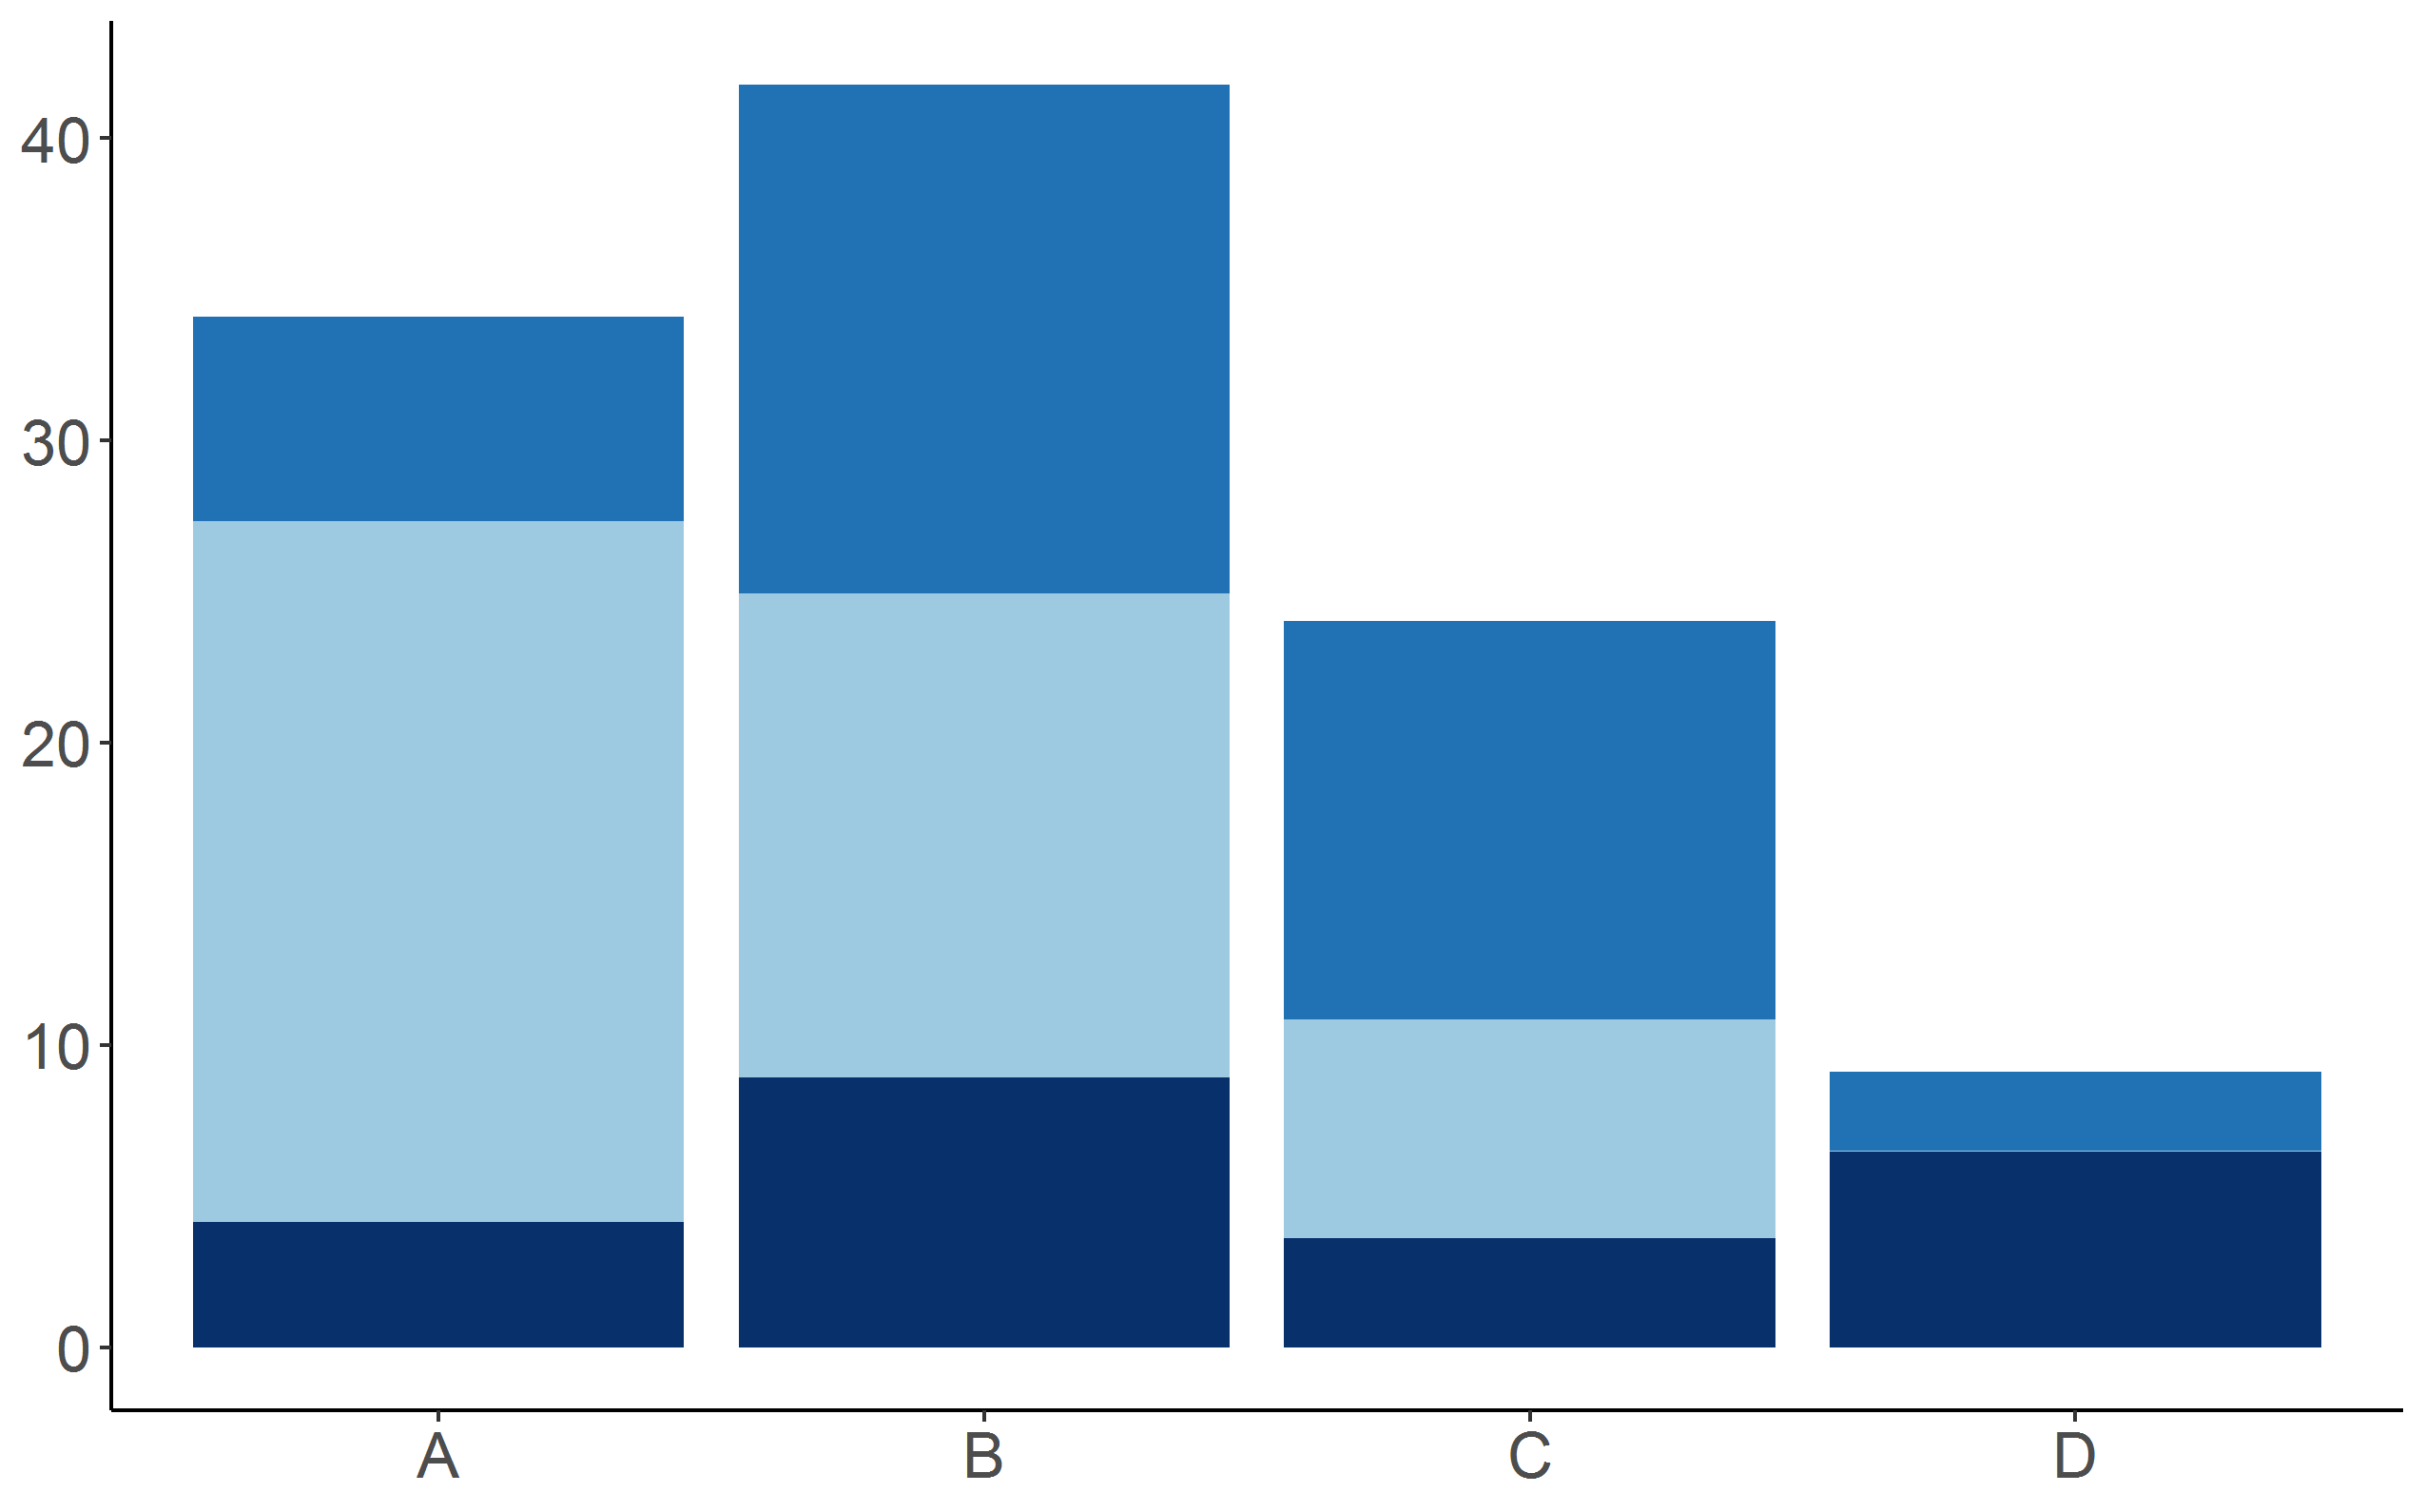
Stacked barplot
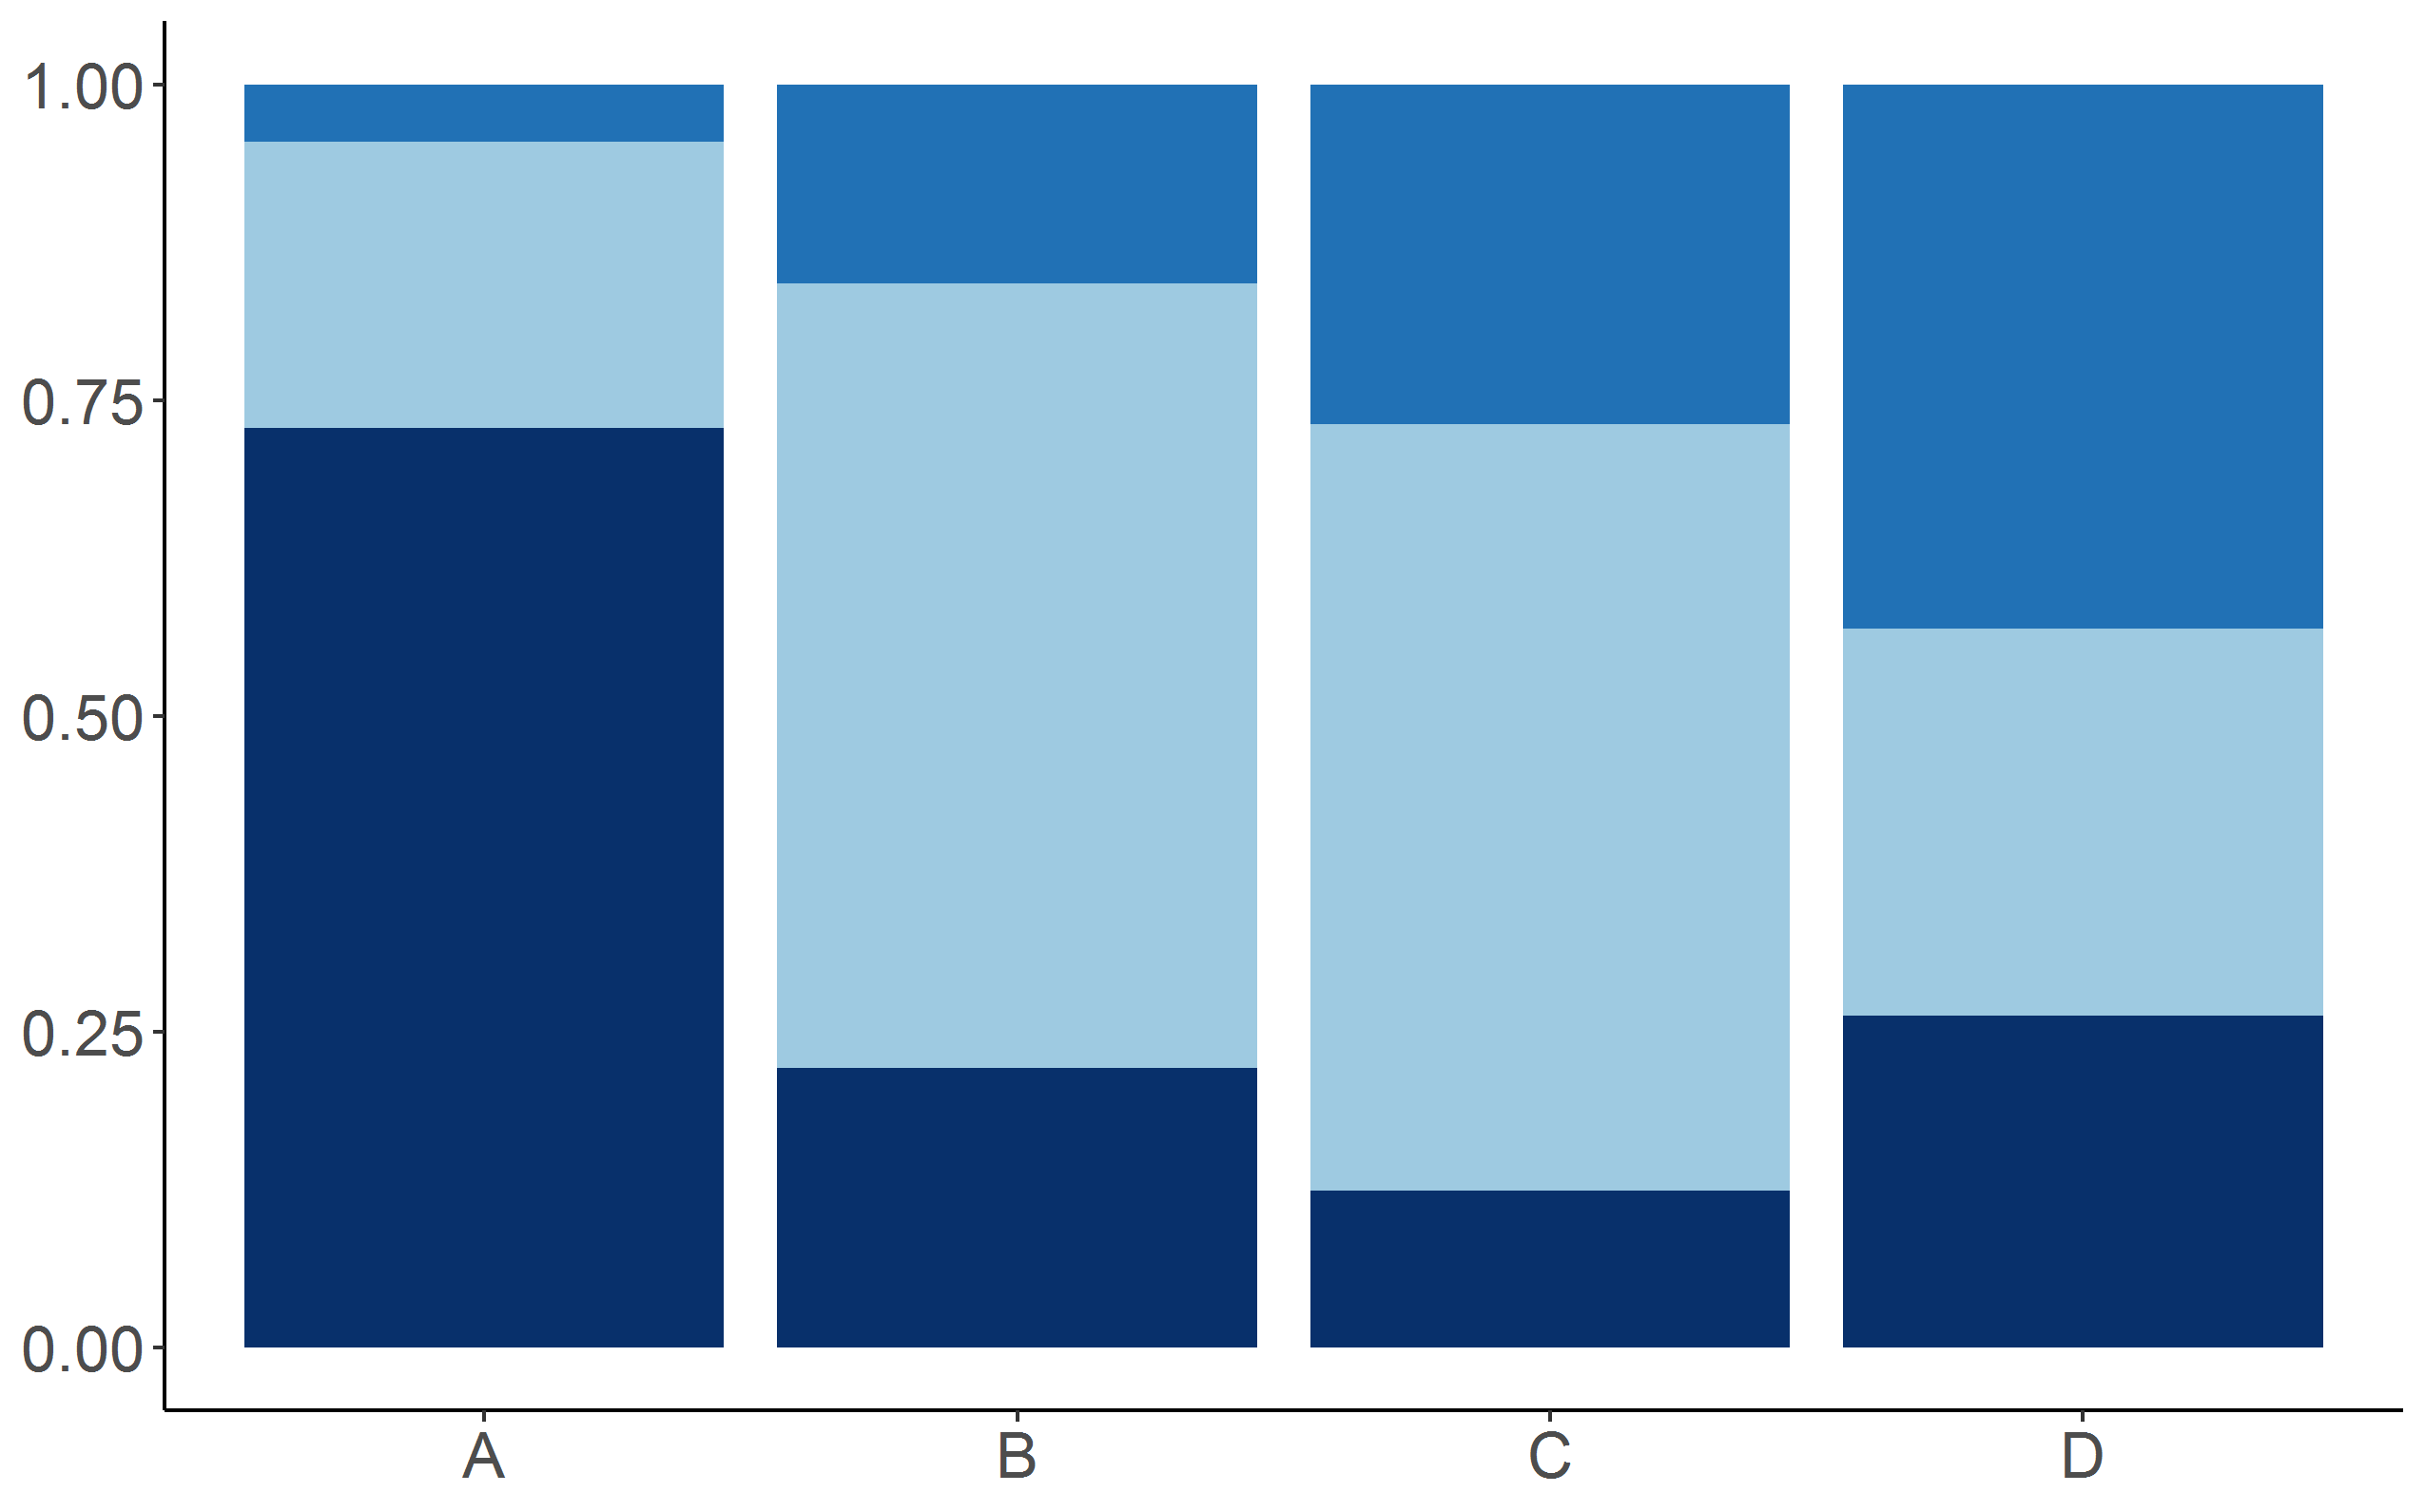
Percent stacked barplot
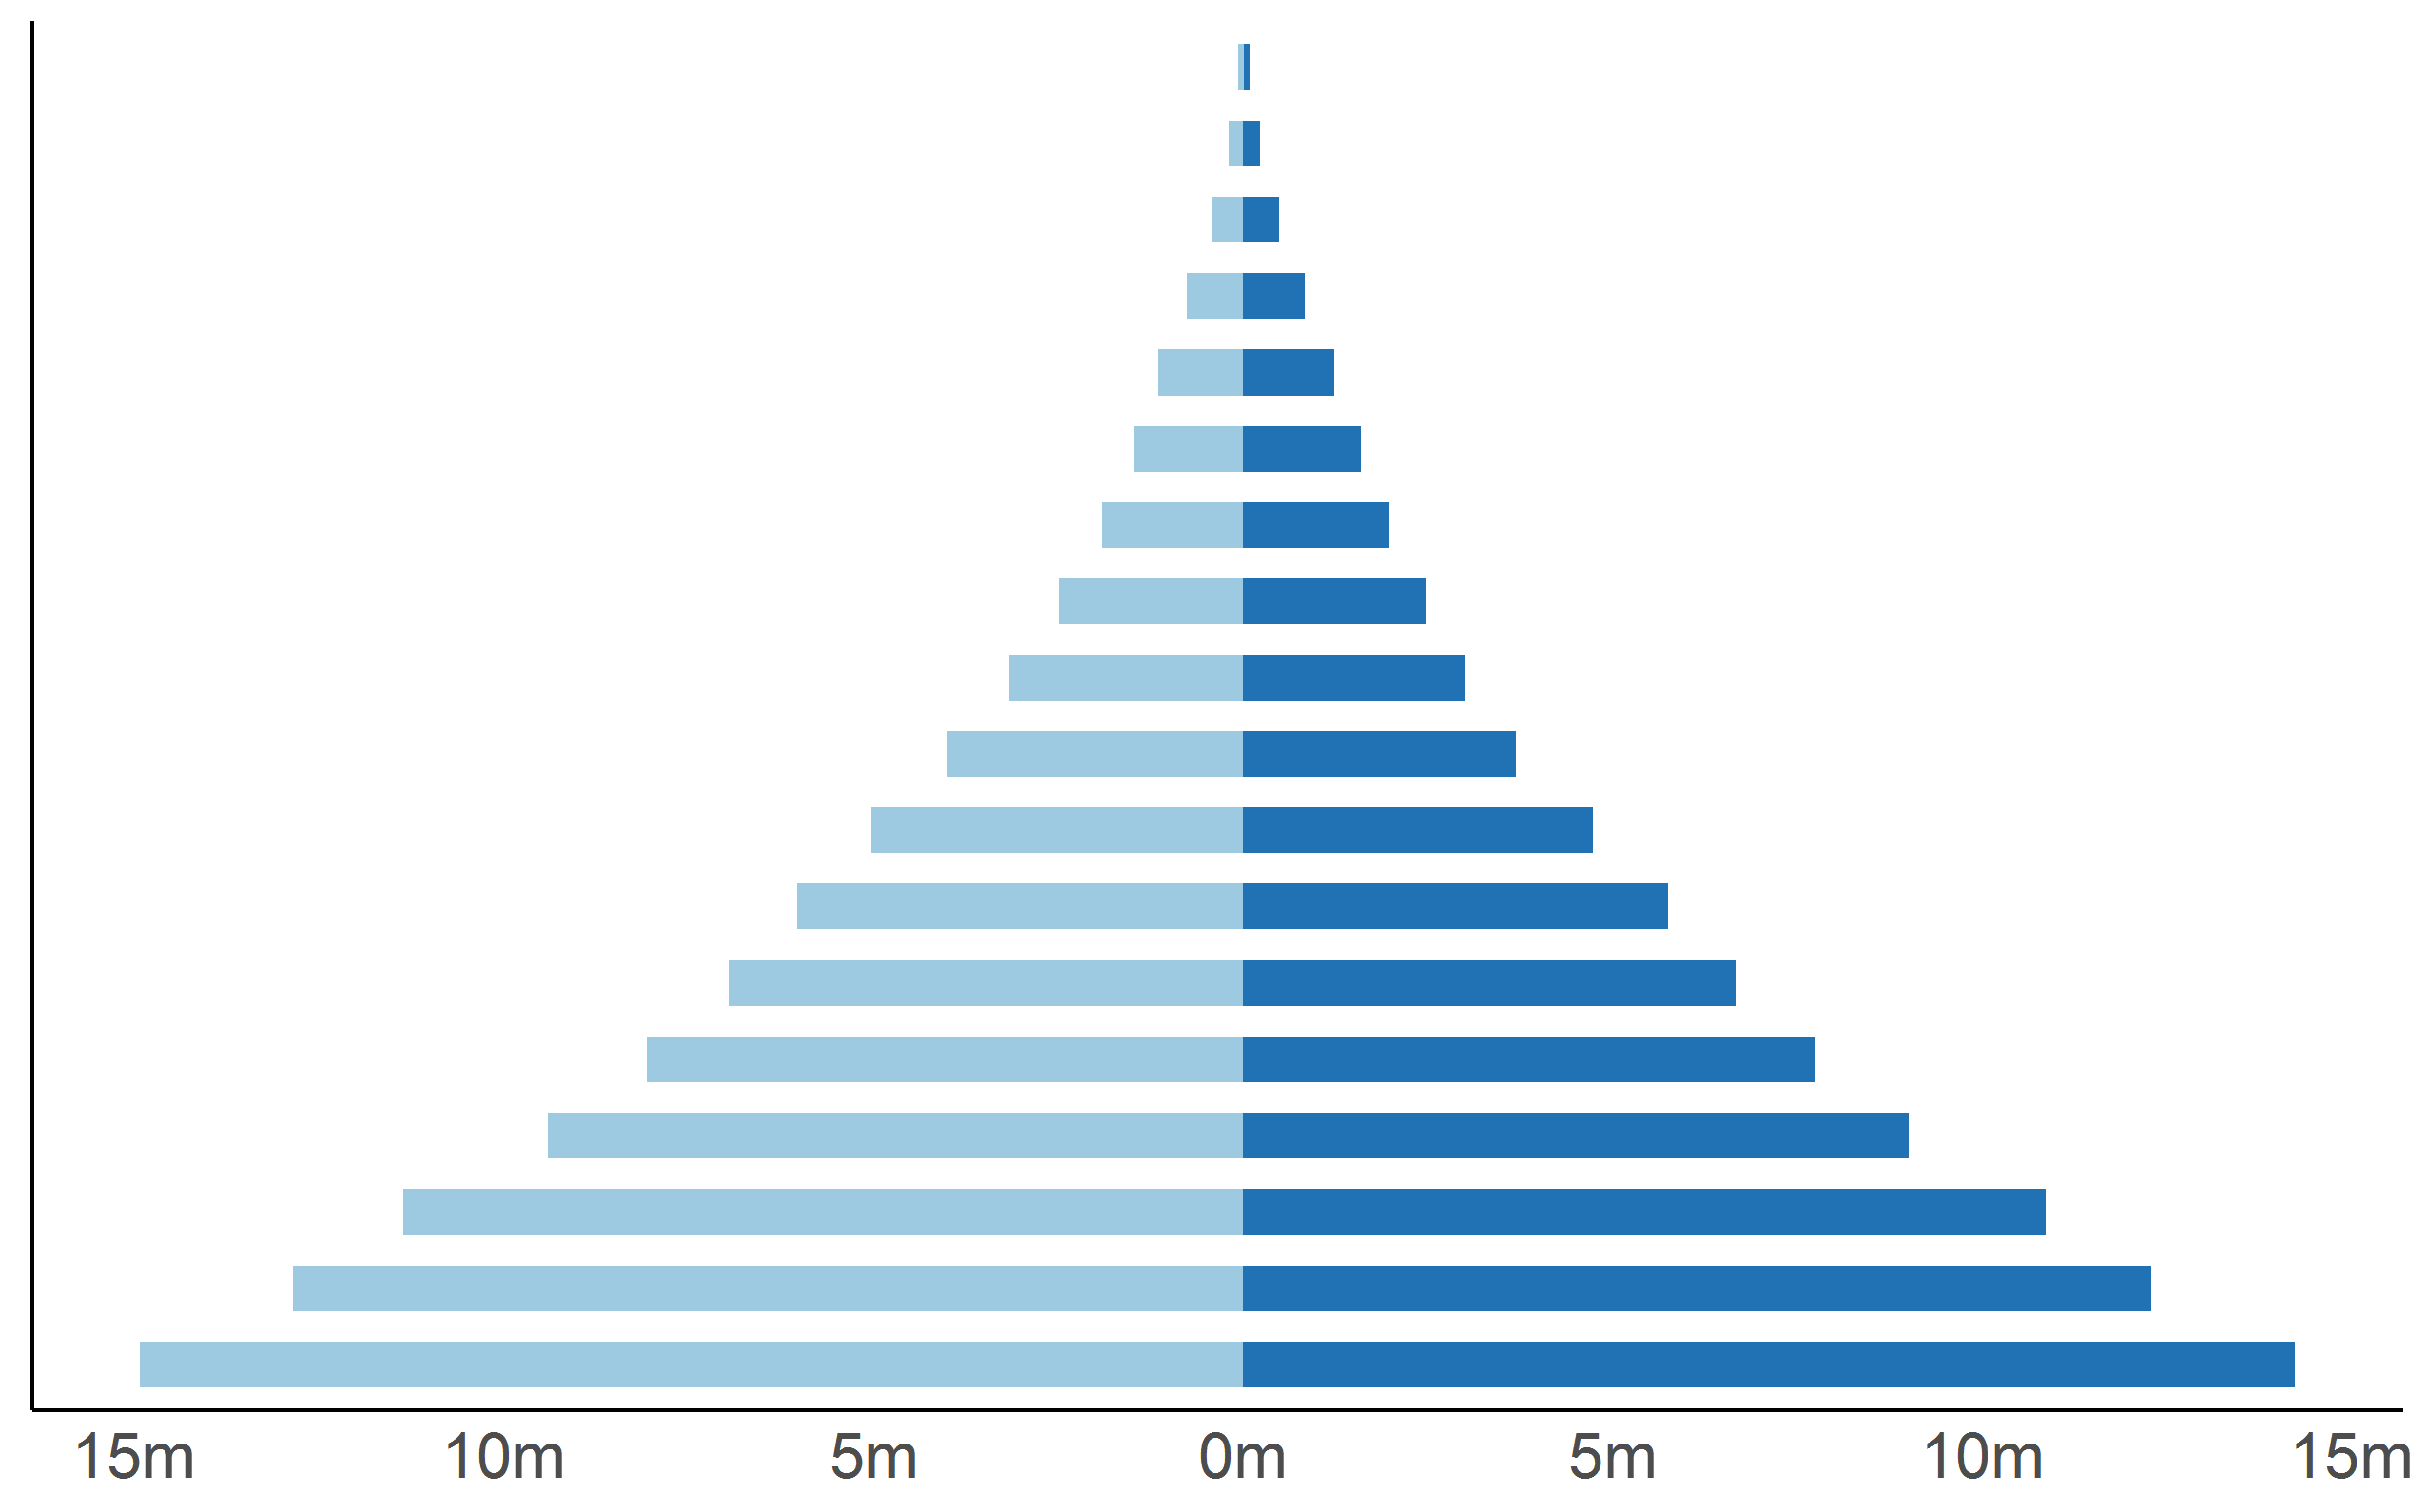
Butterfly barplot
Circular barplot
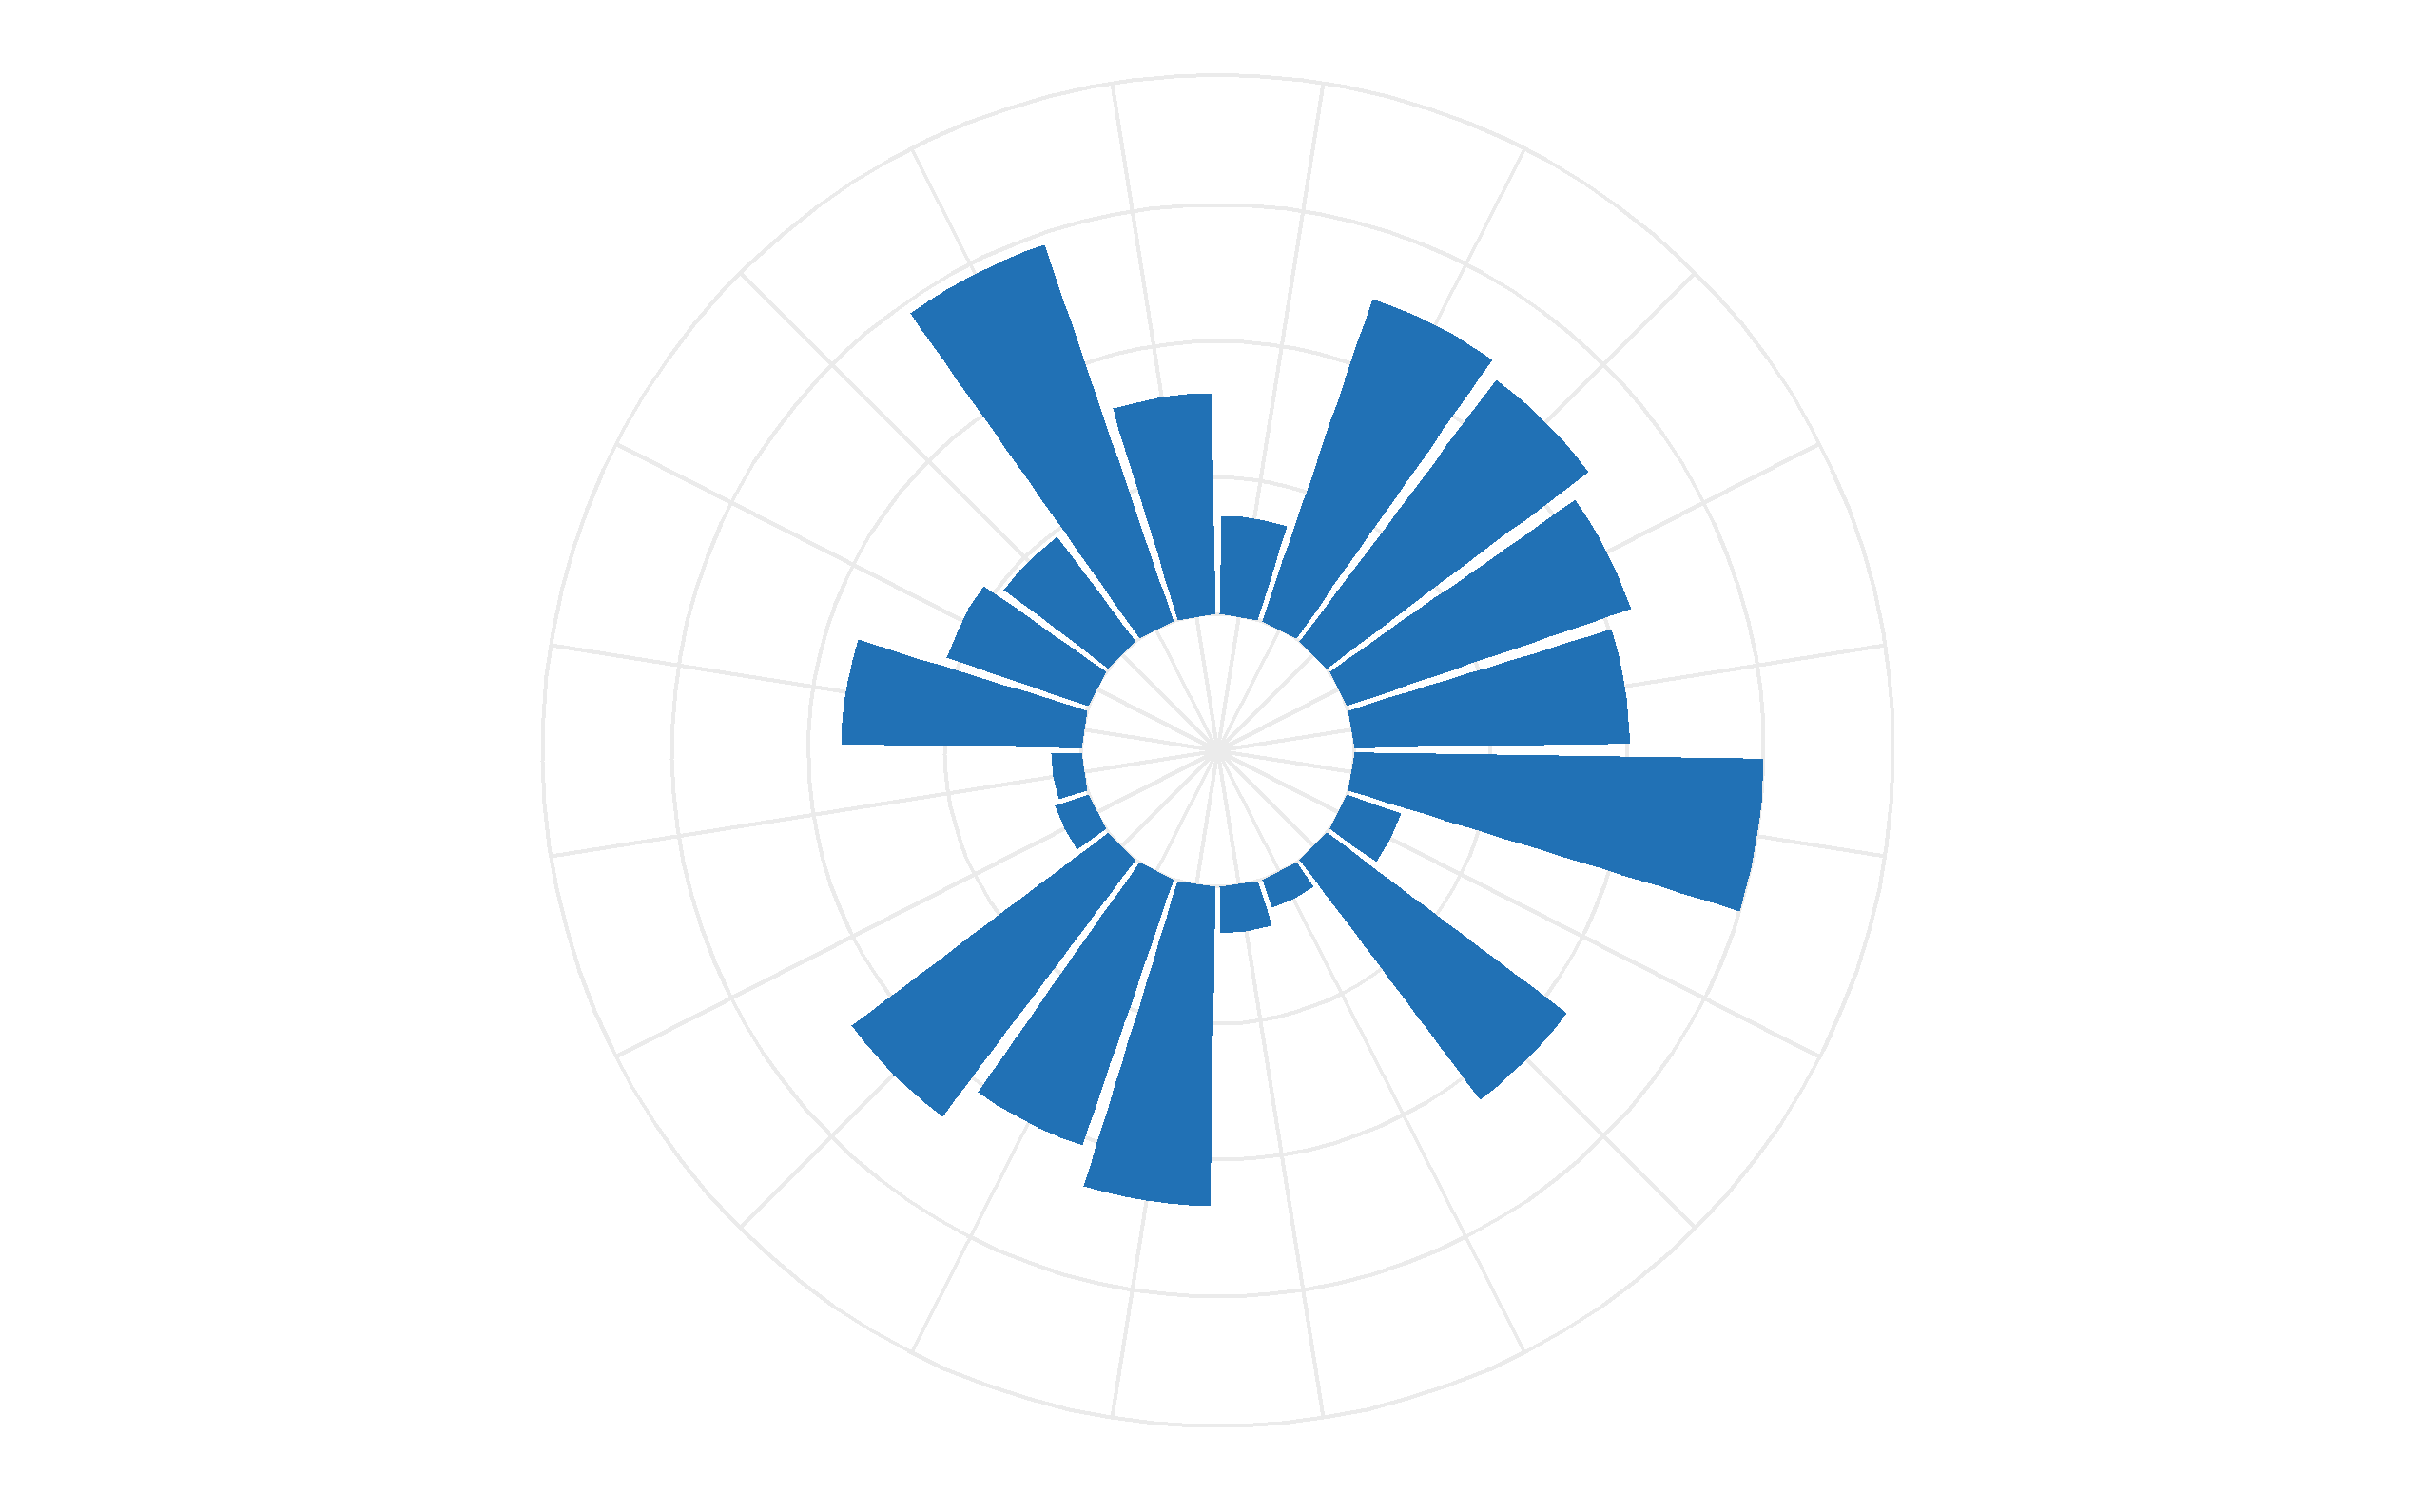
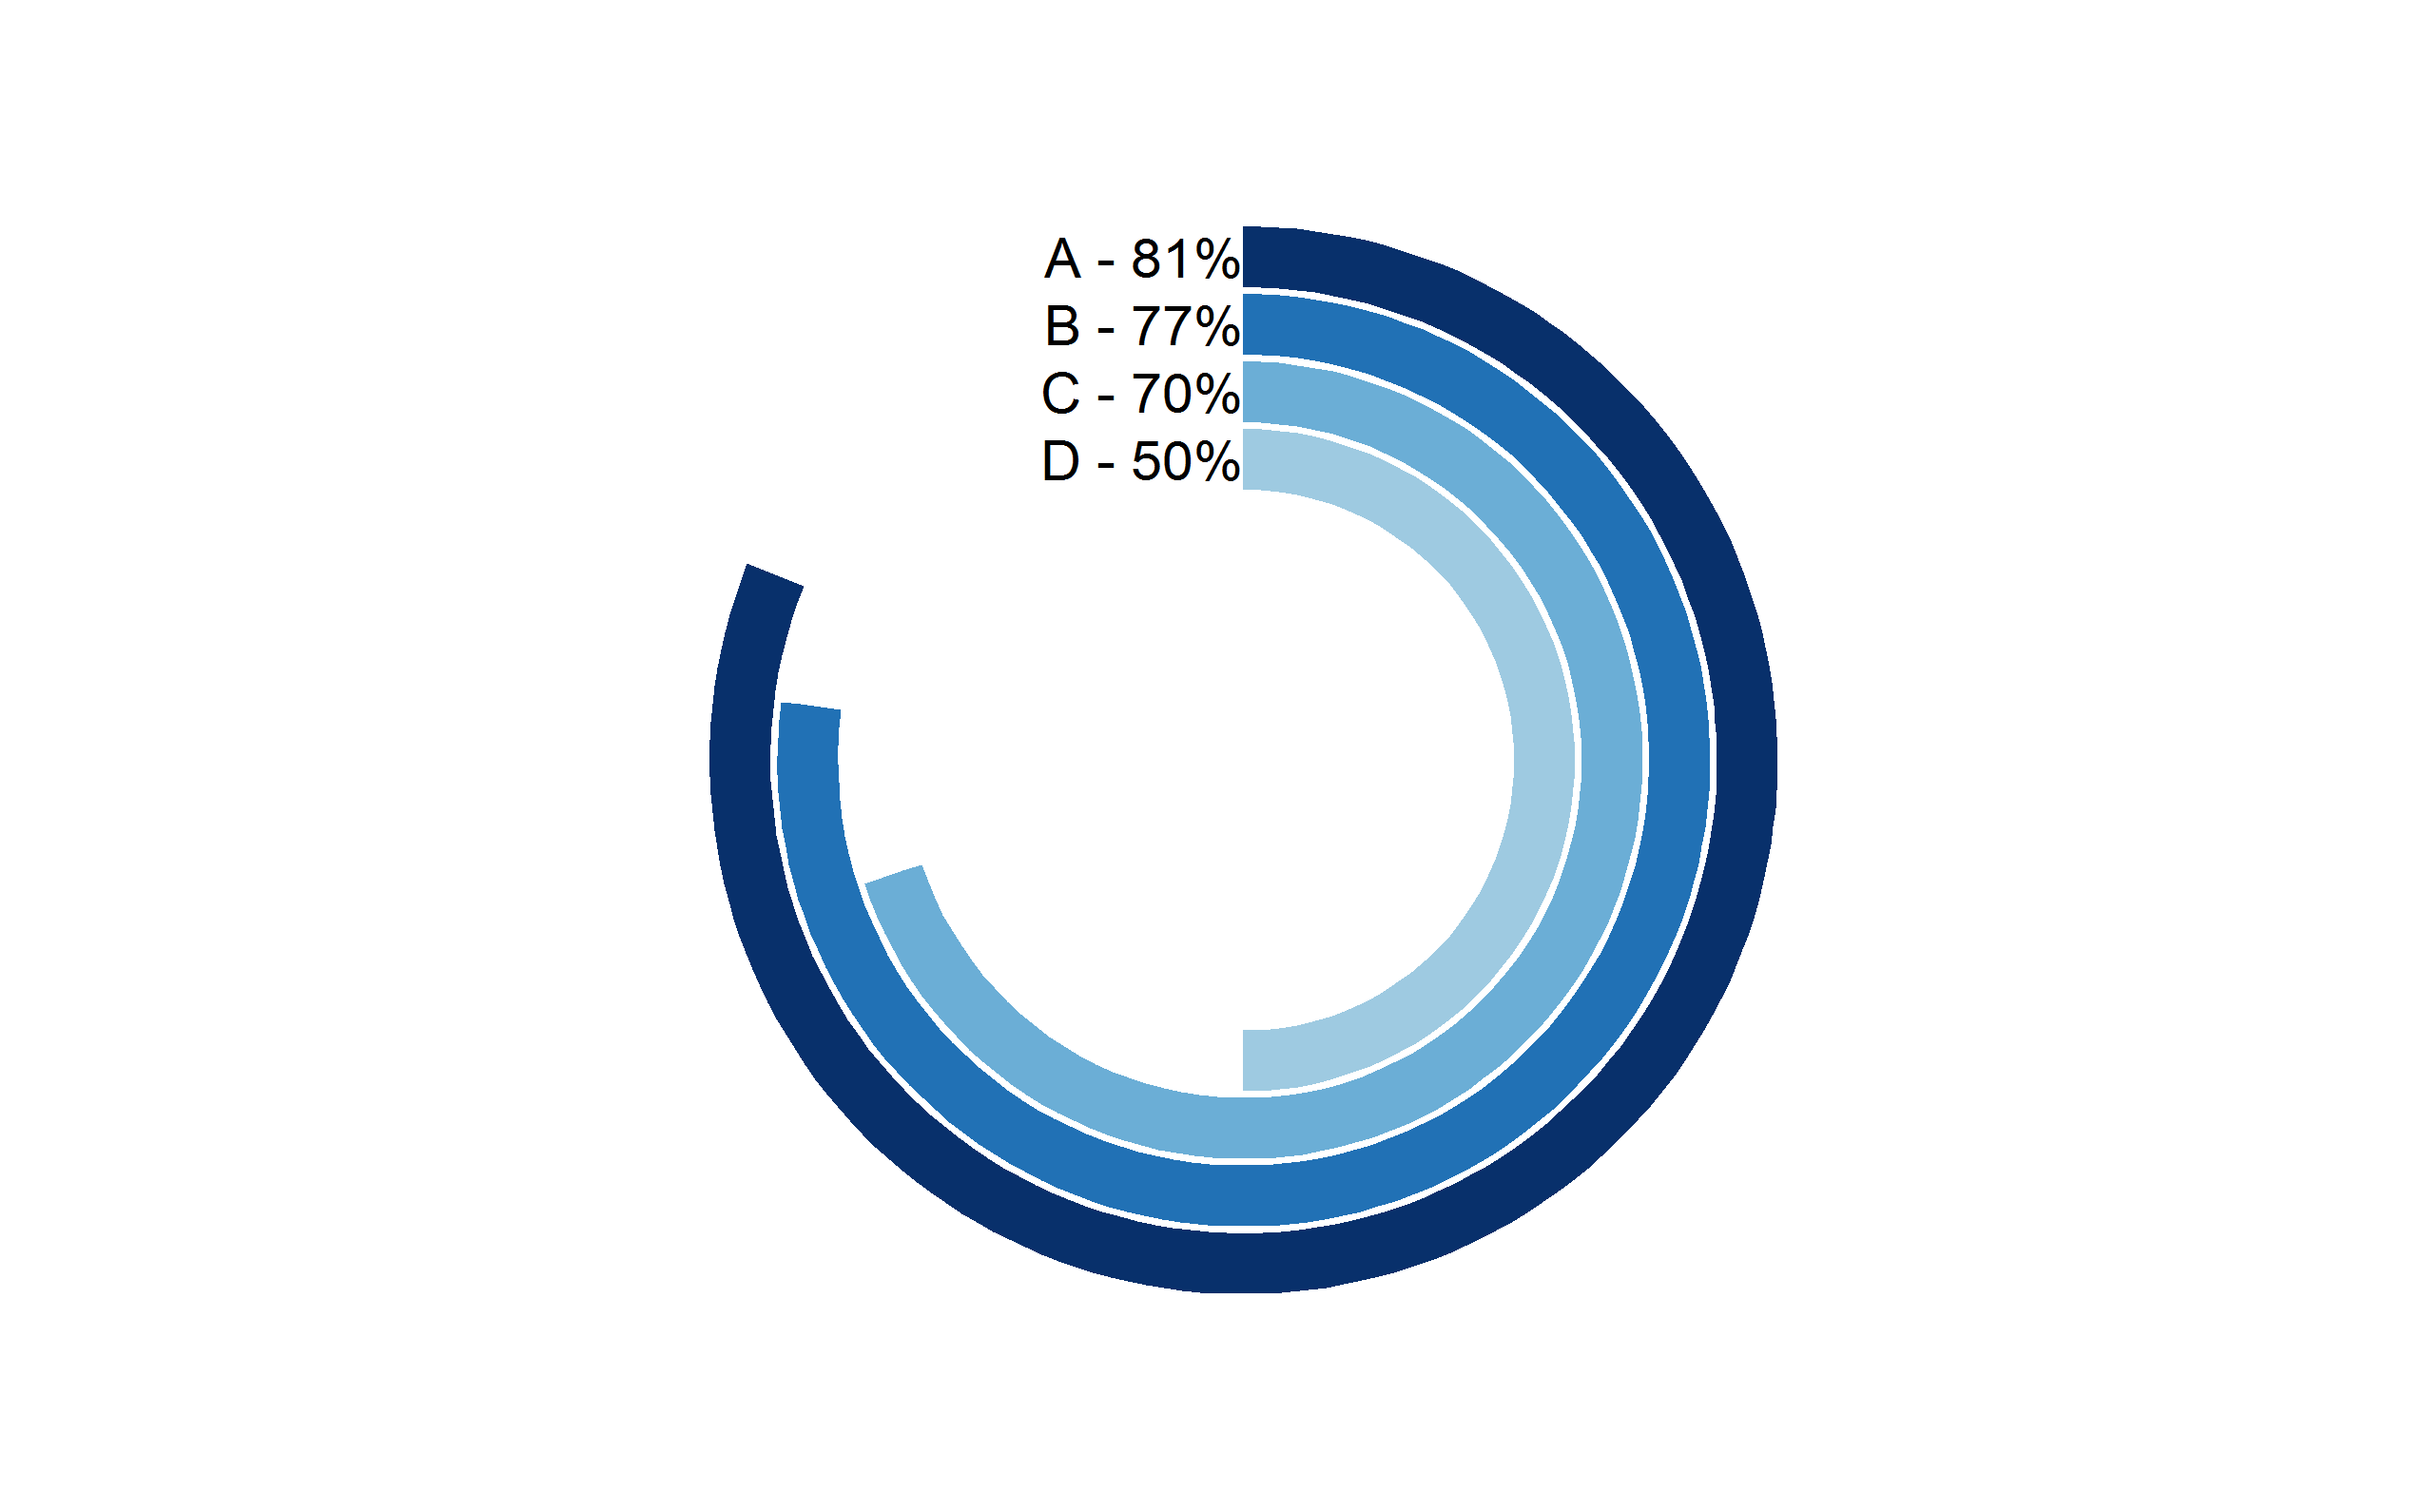
Radial barplot
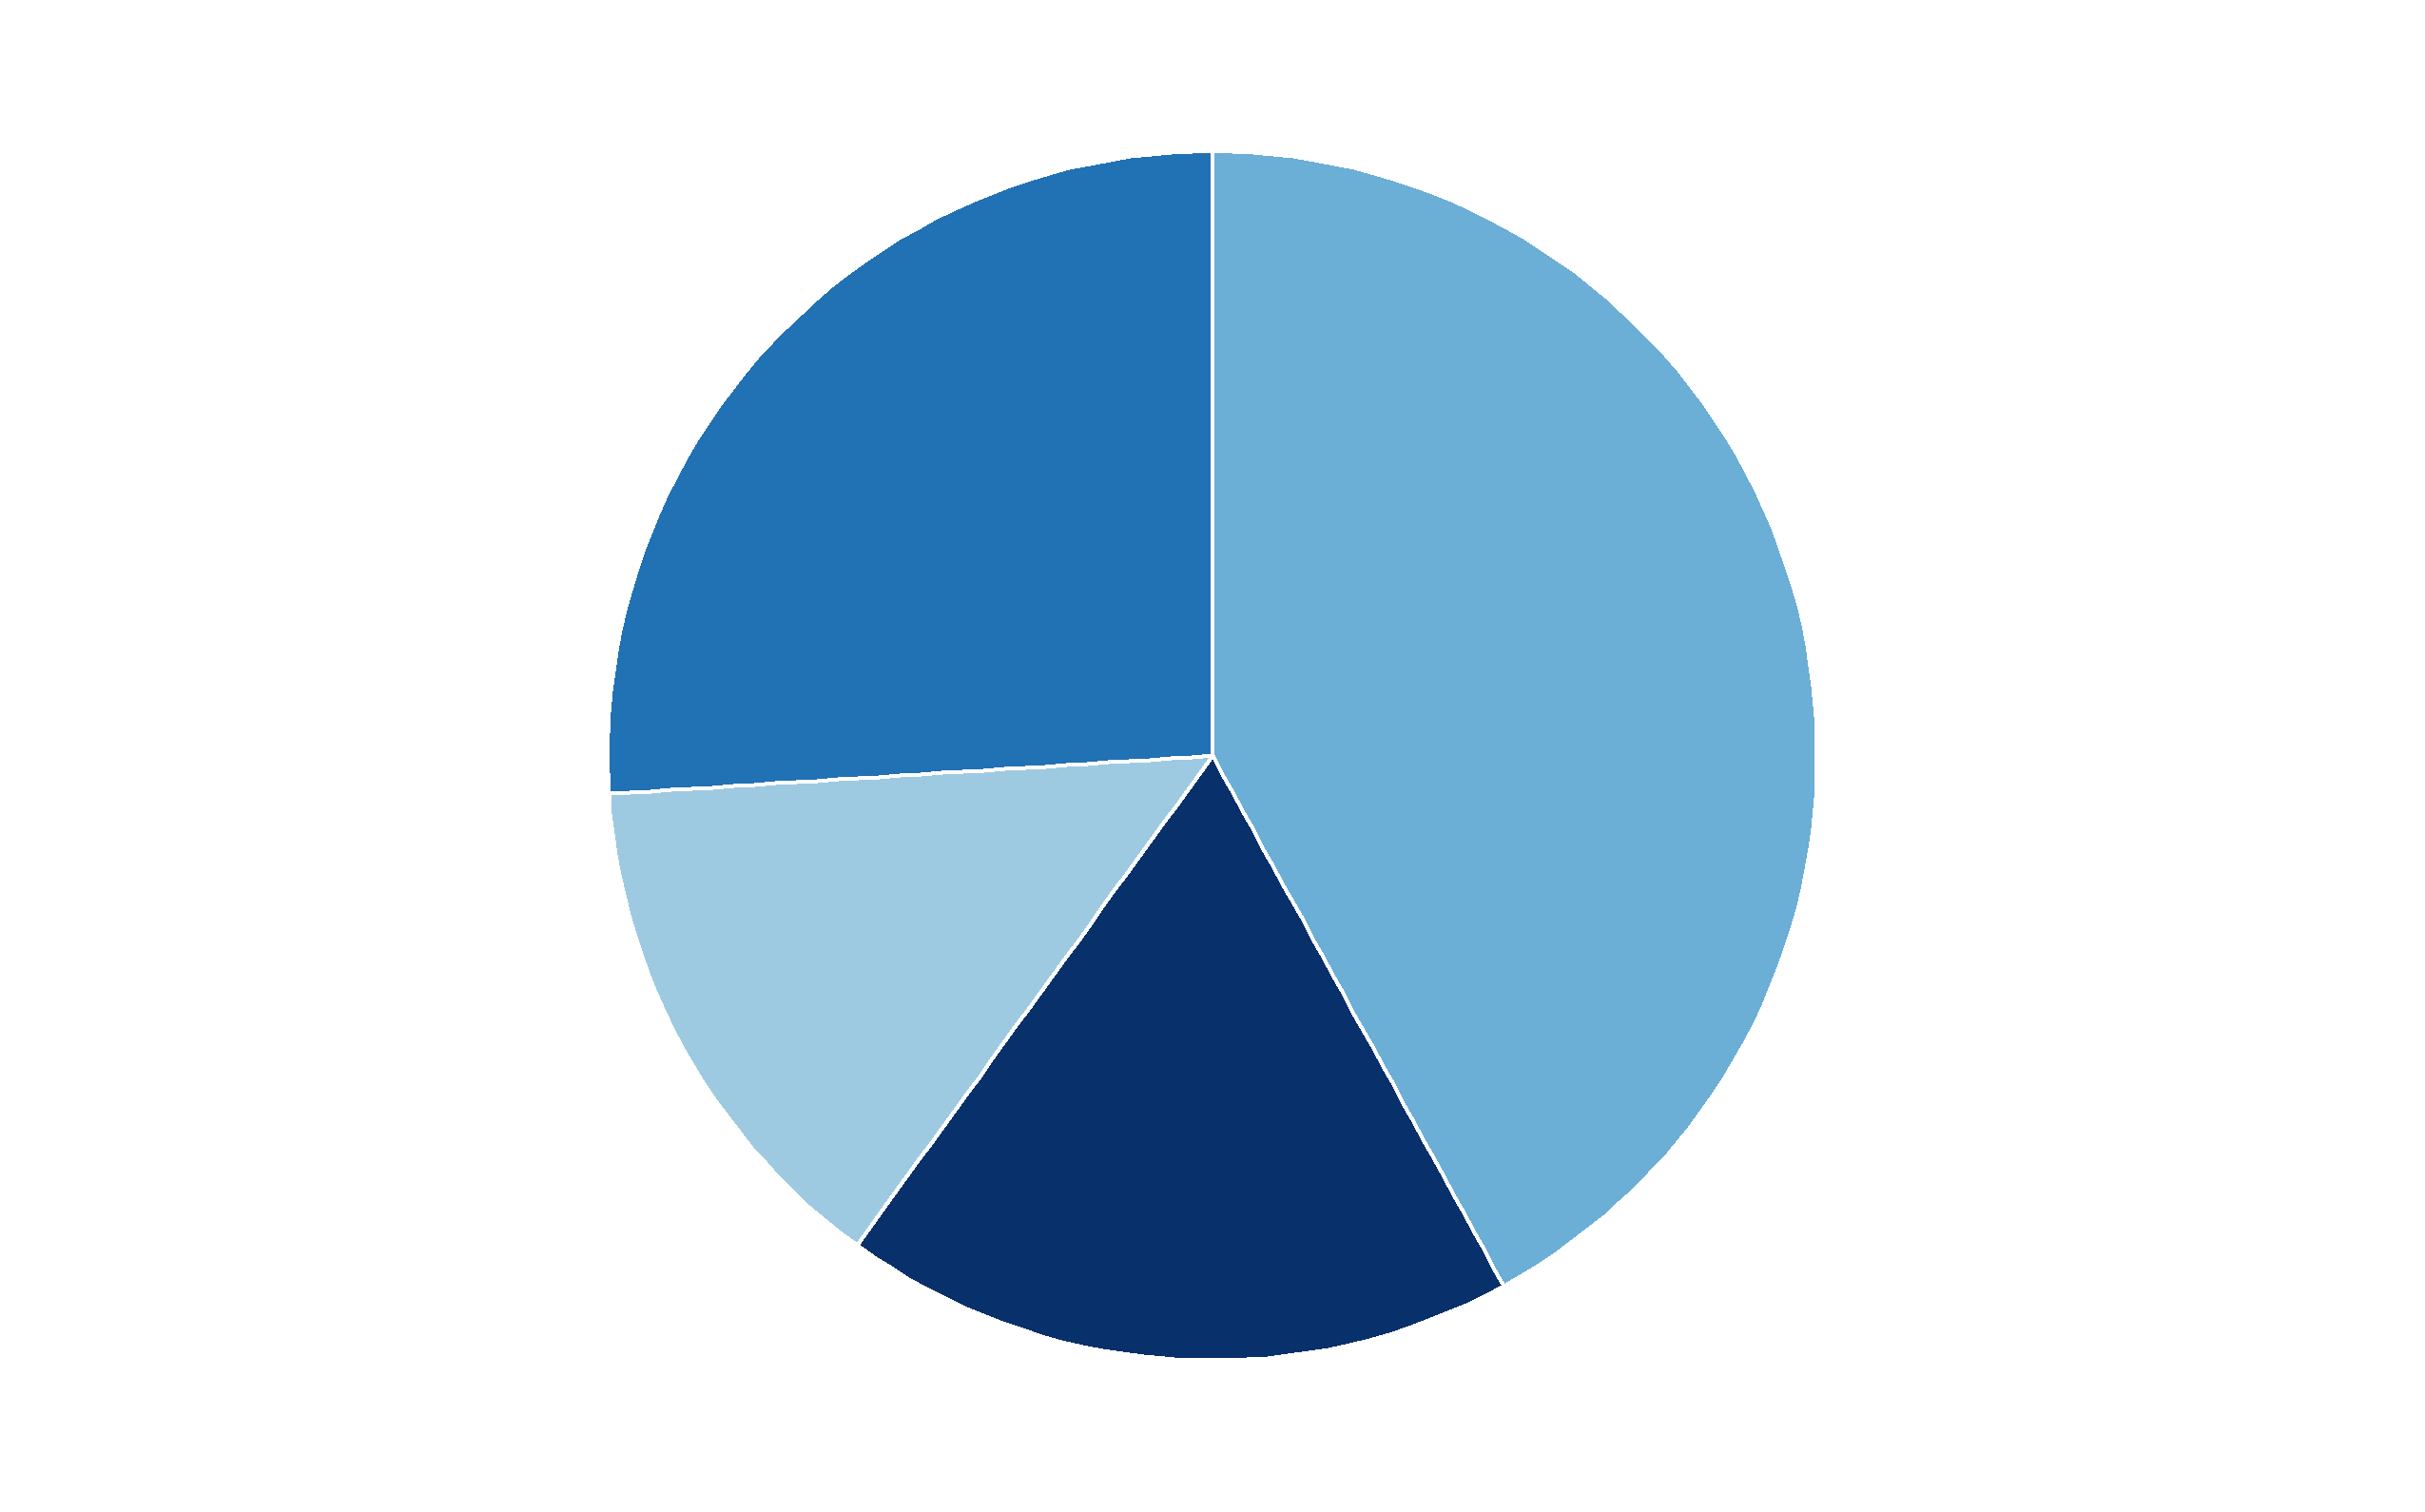
Piechart
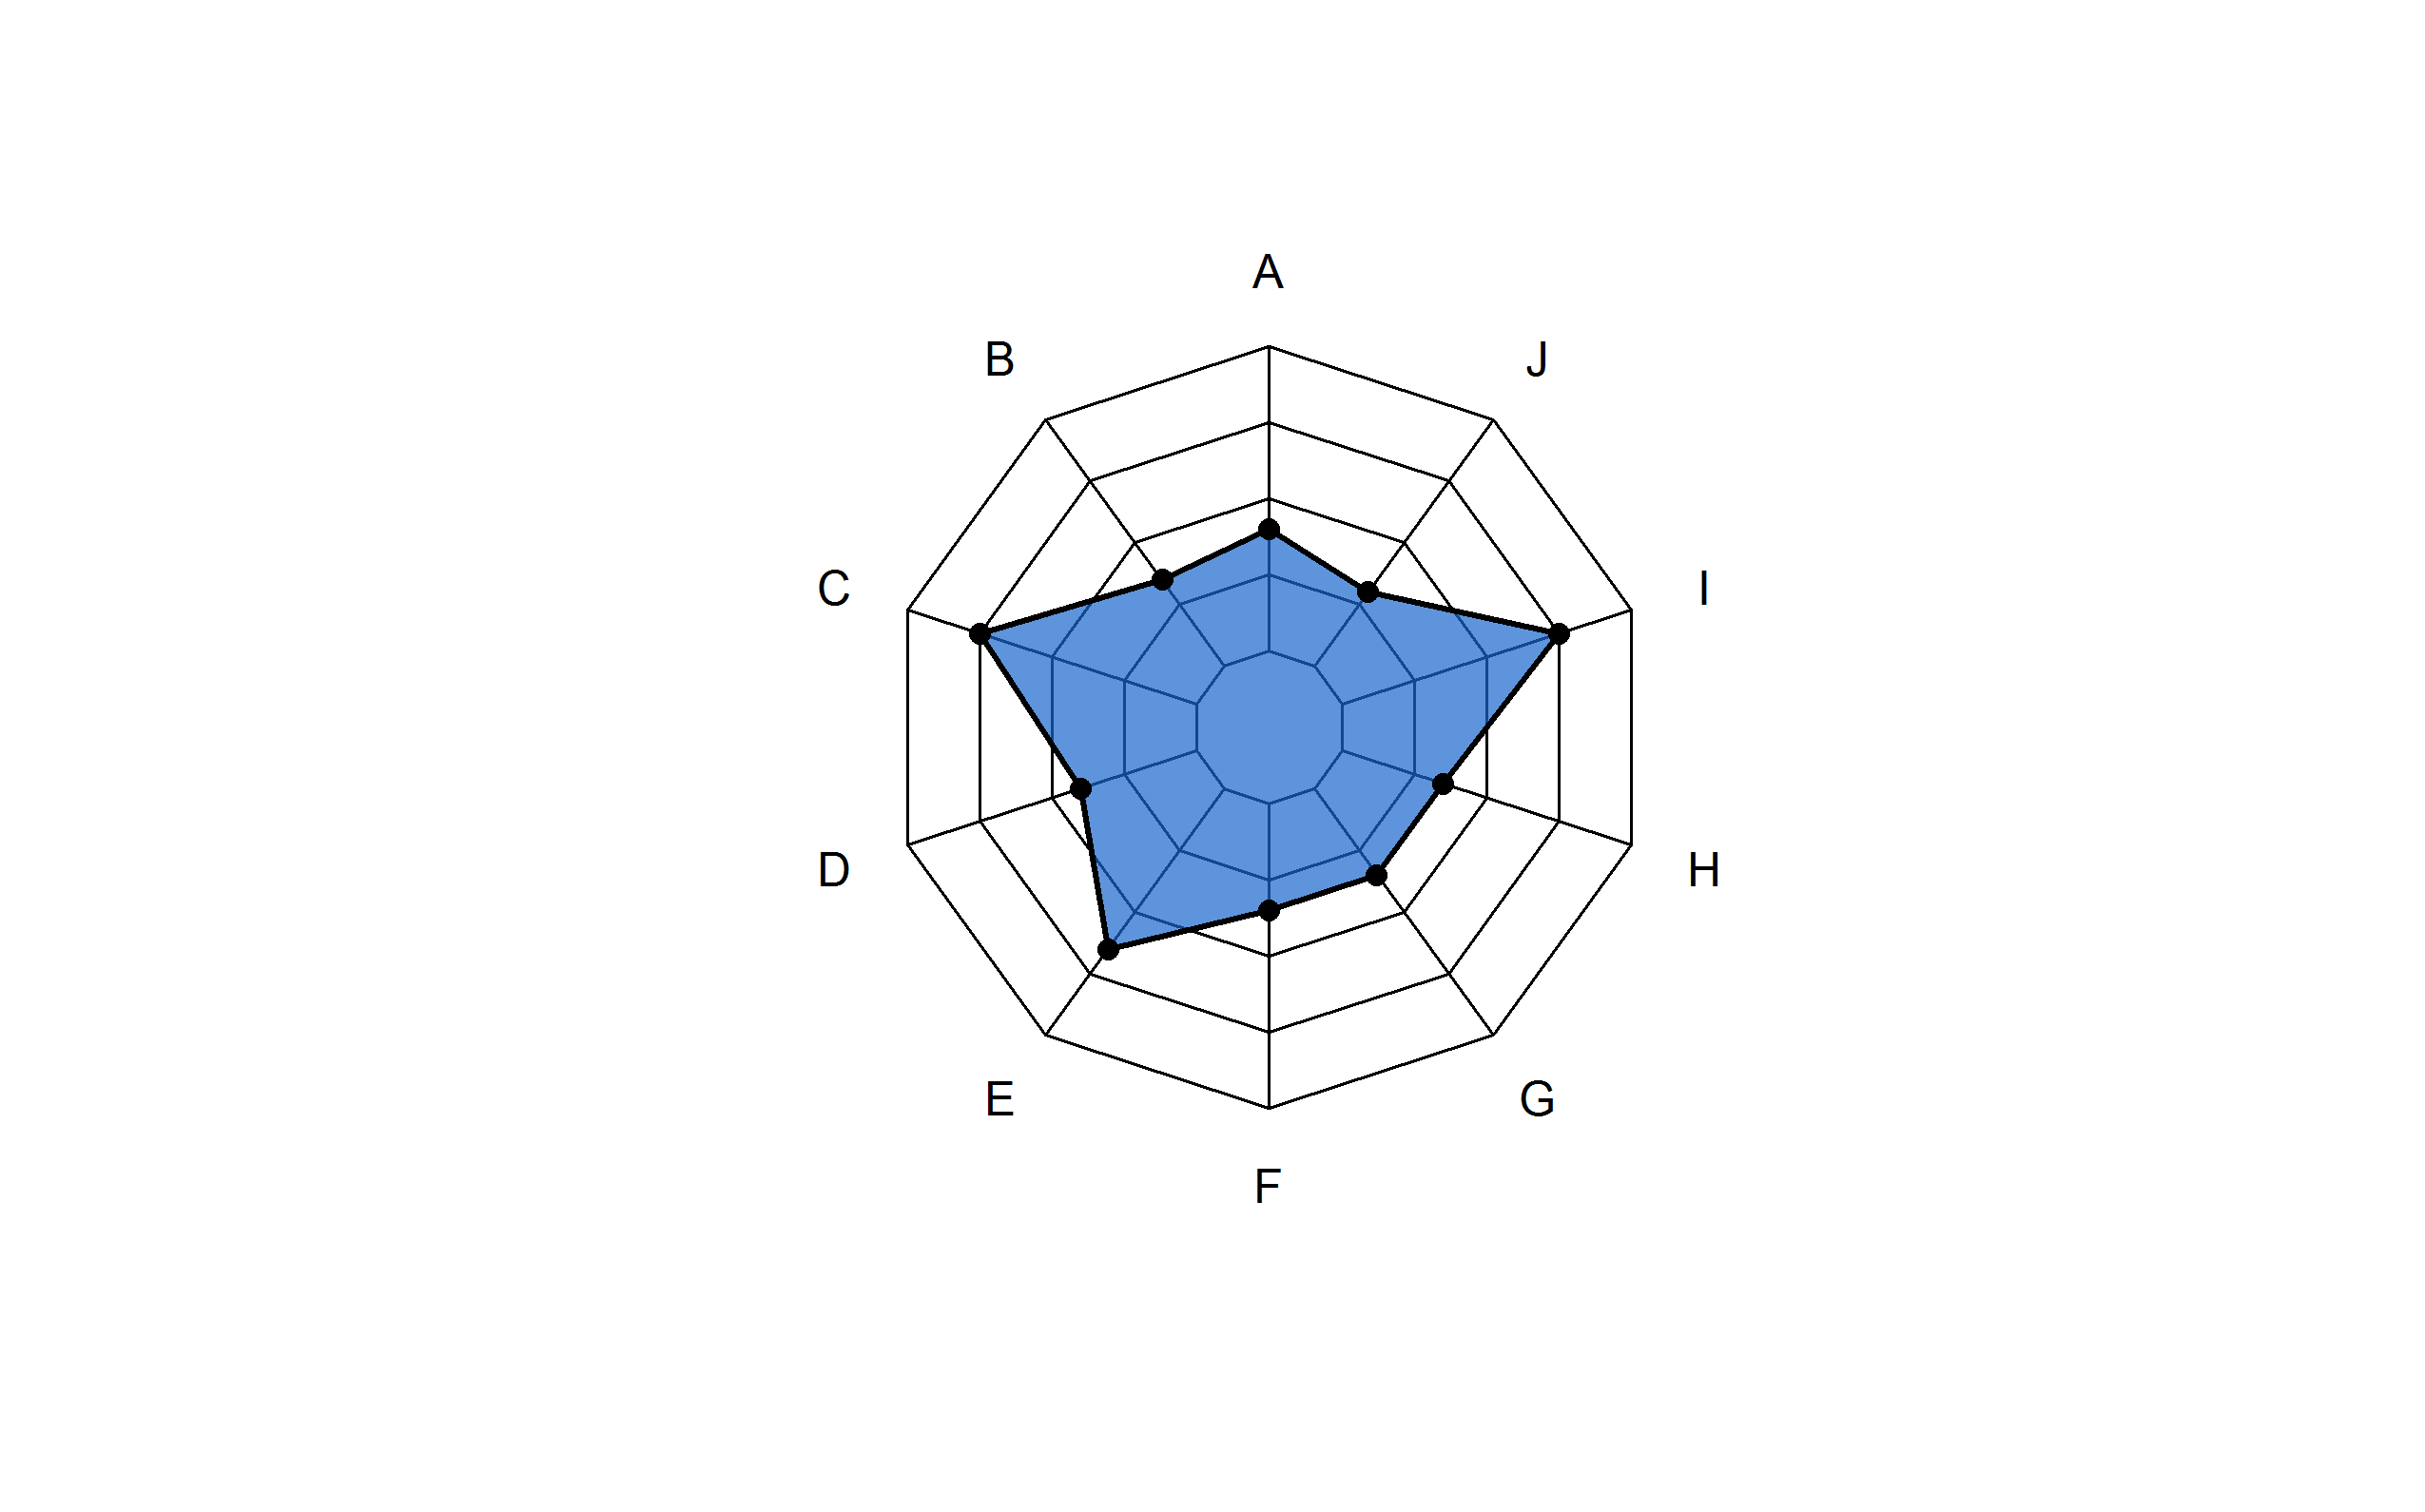
Radar chart
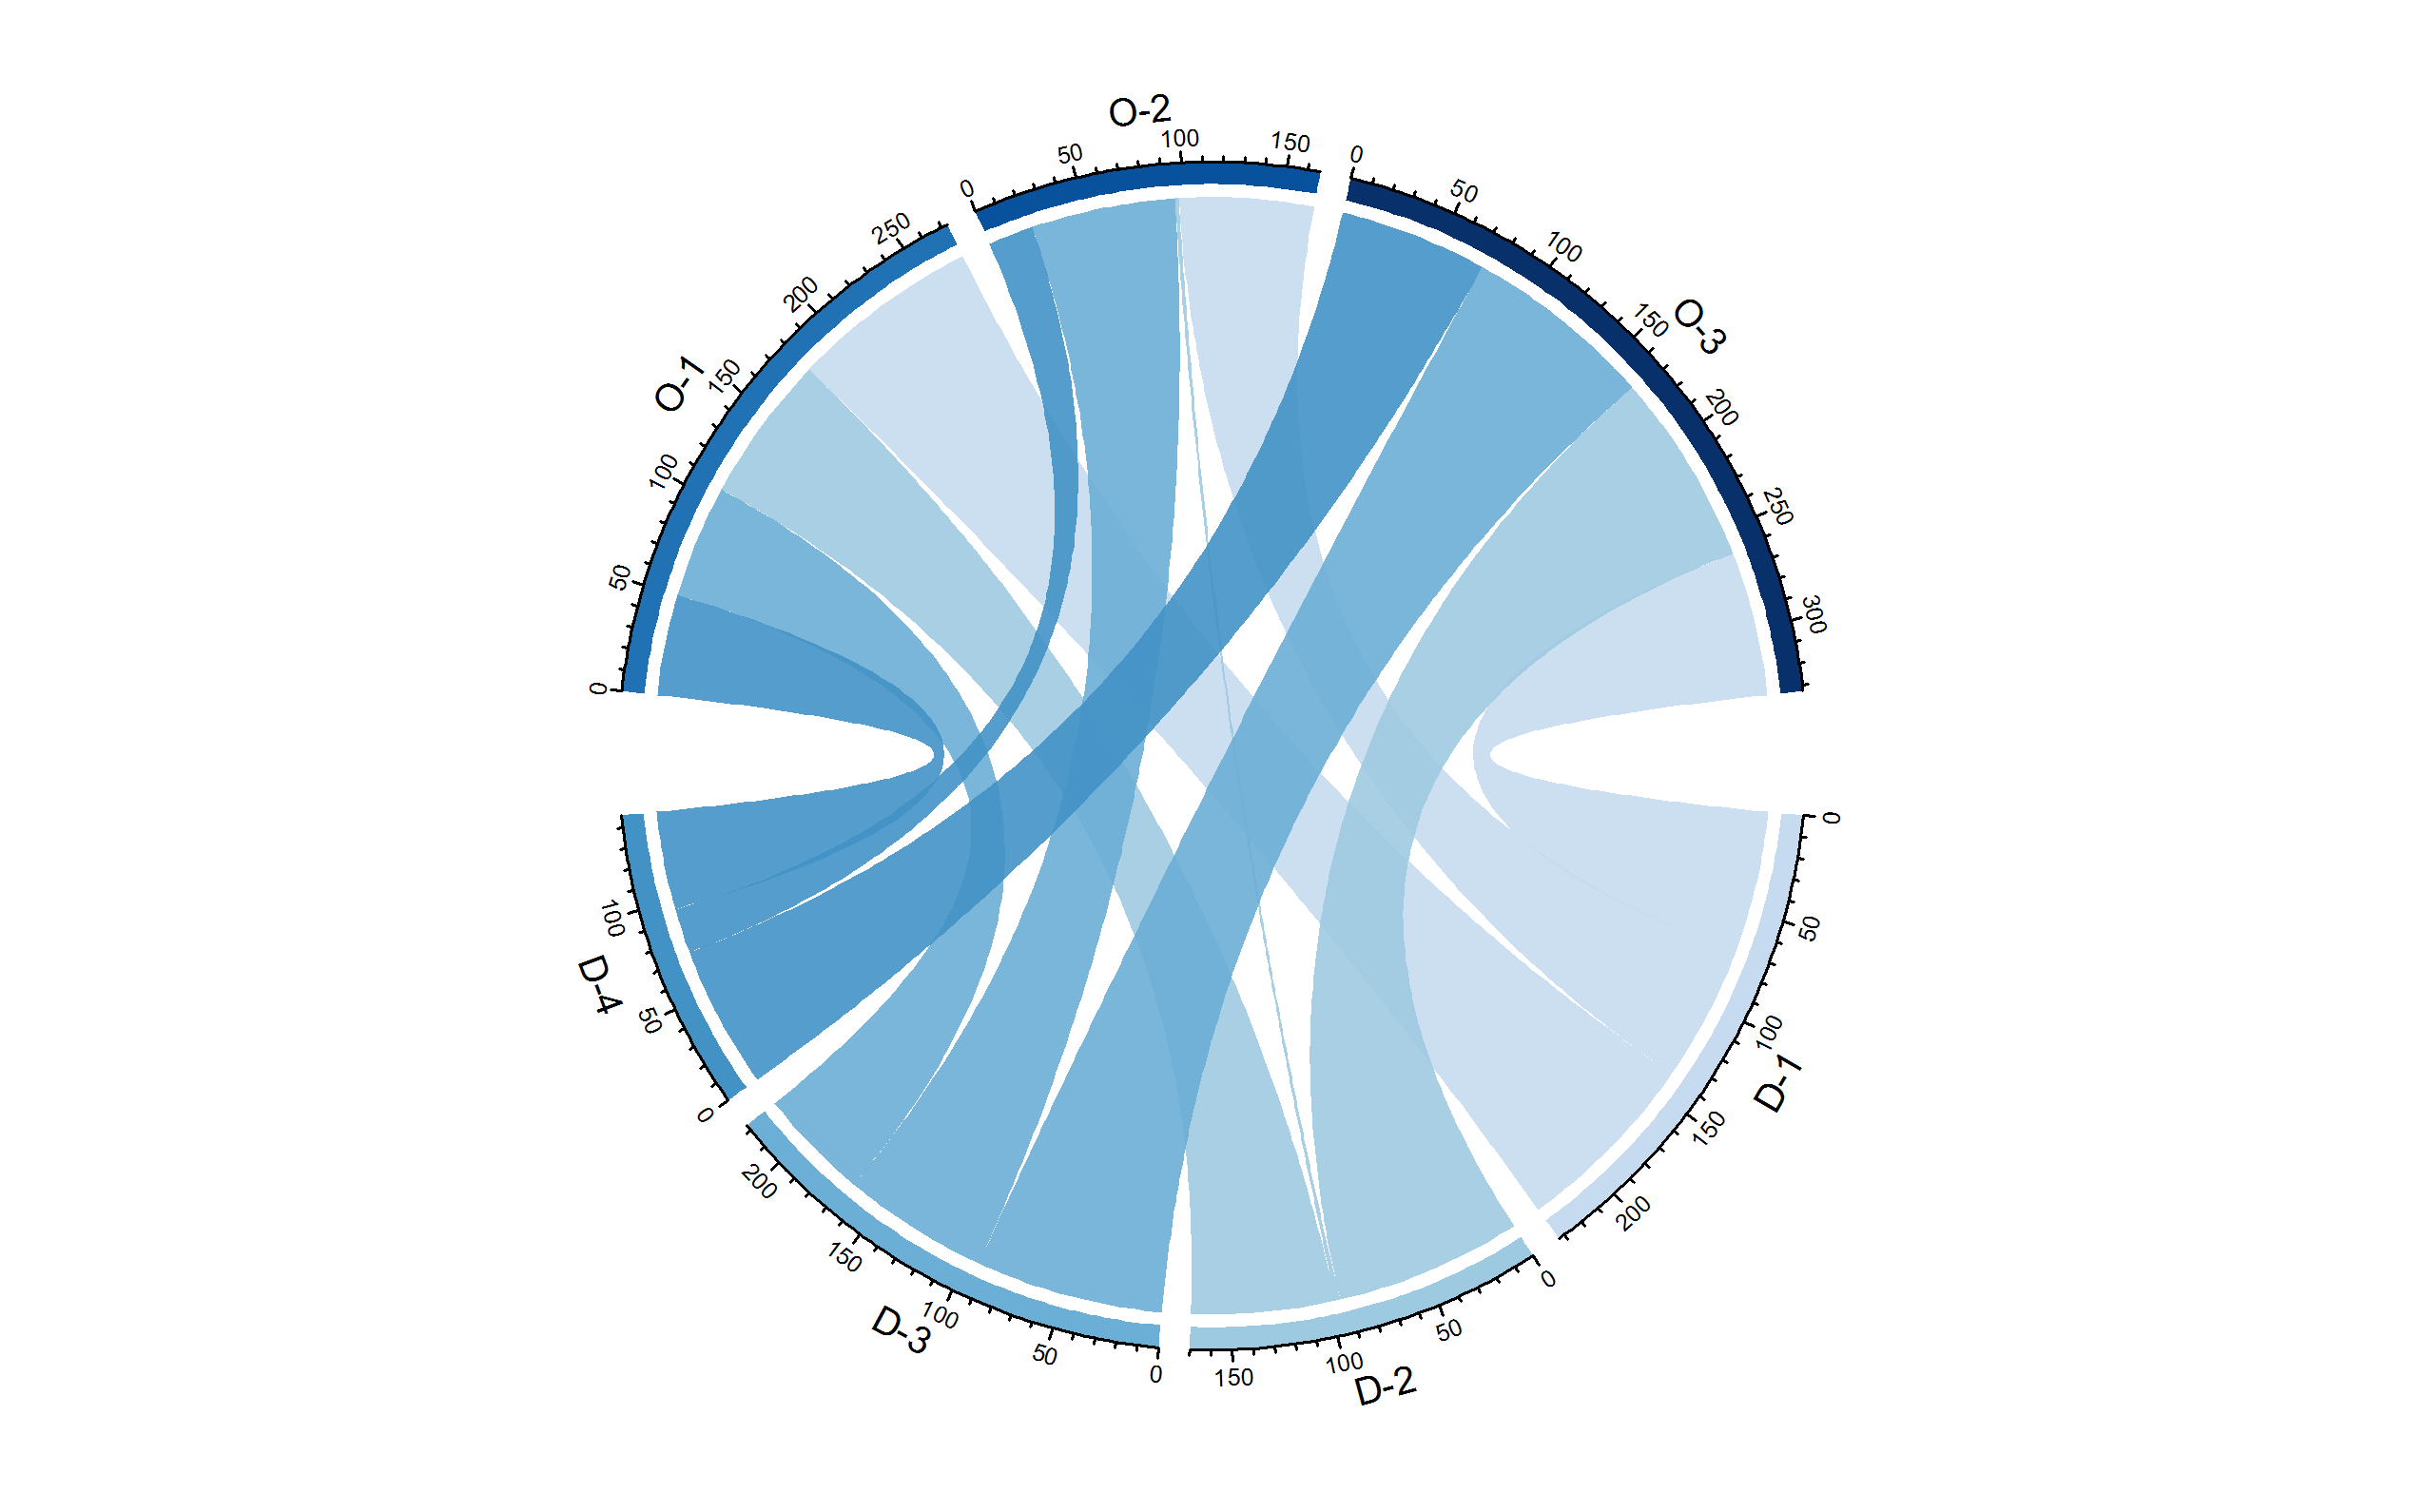
Chord plot
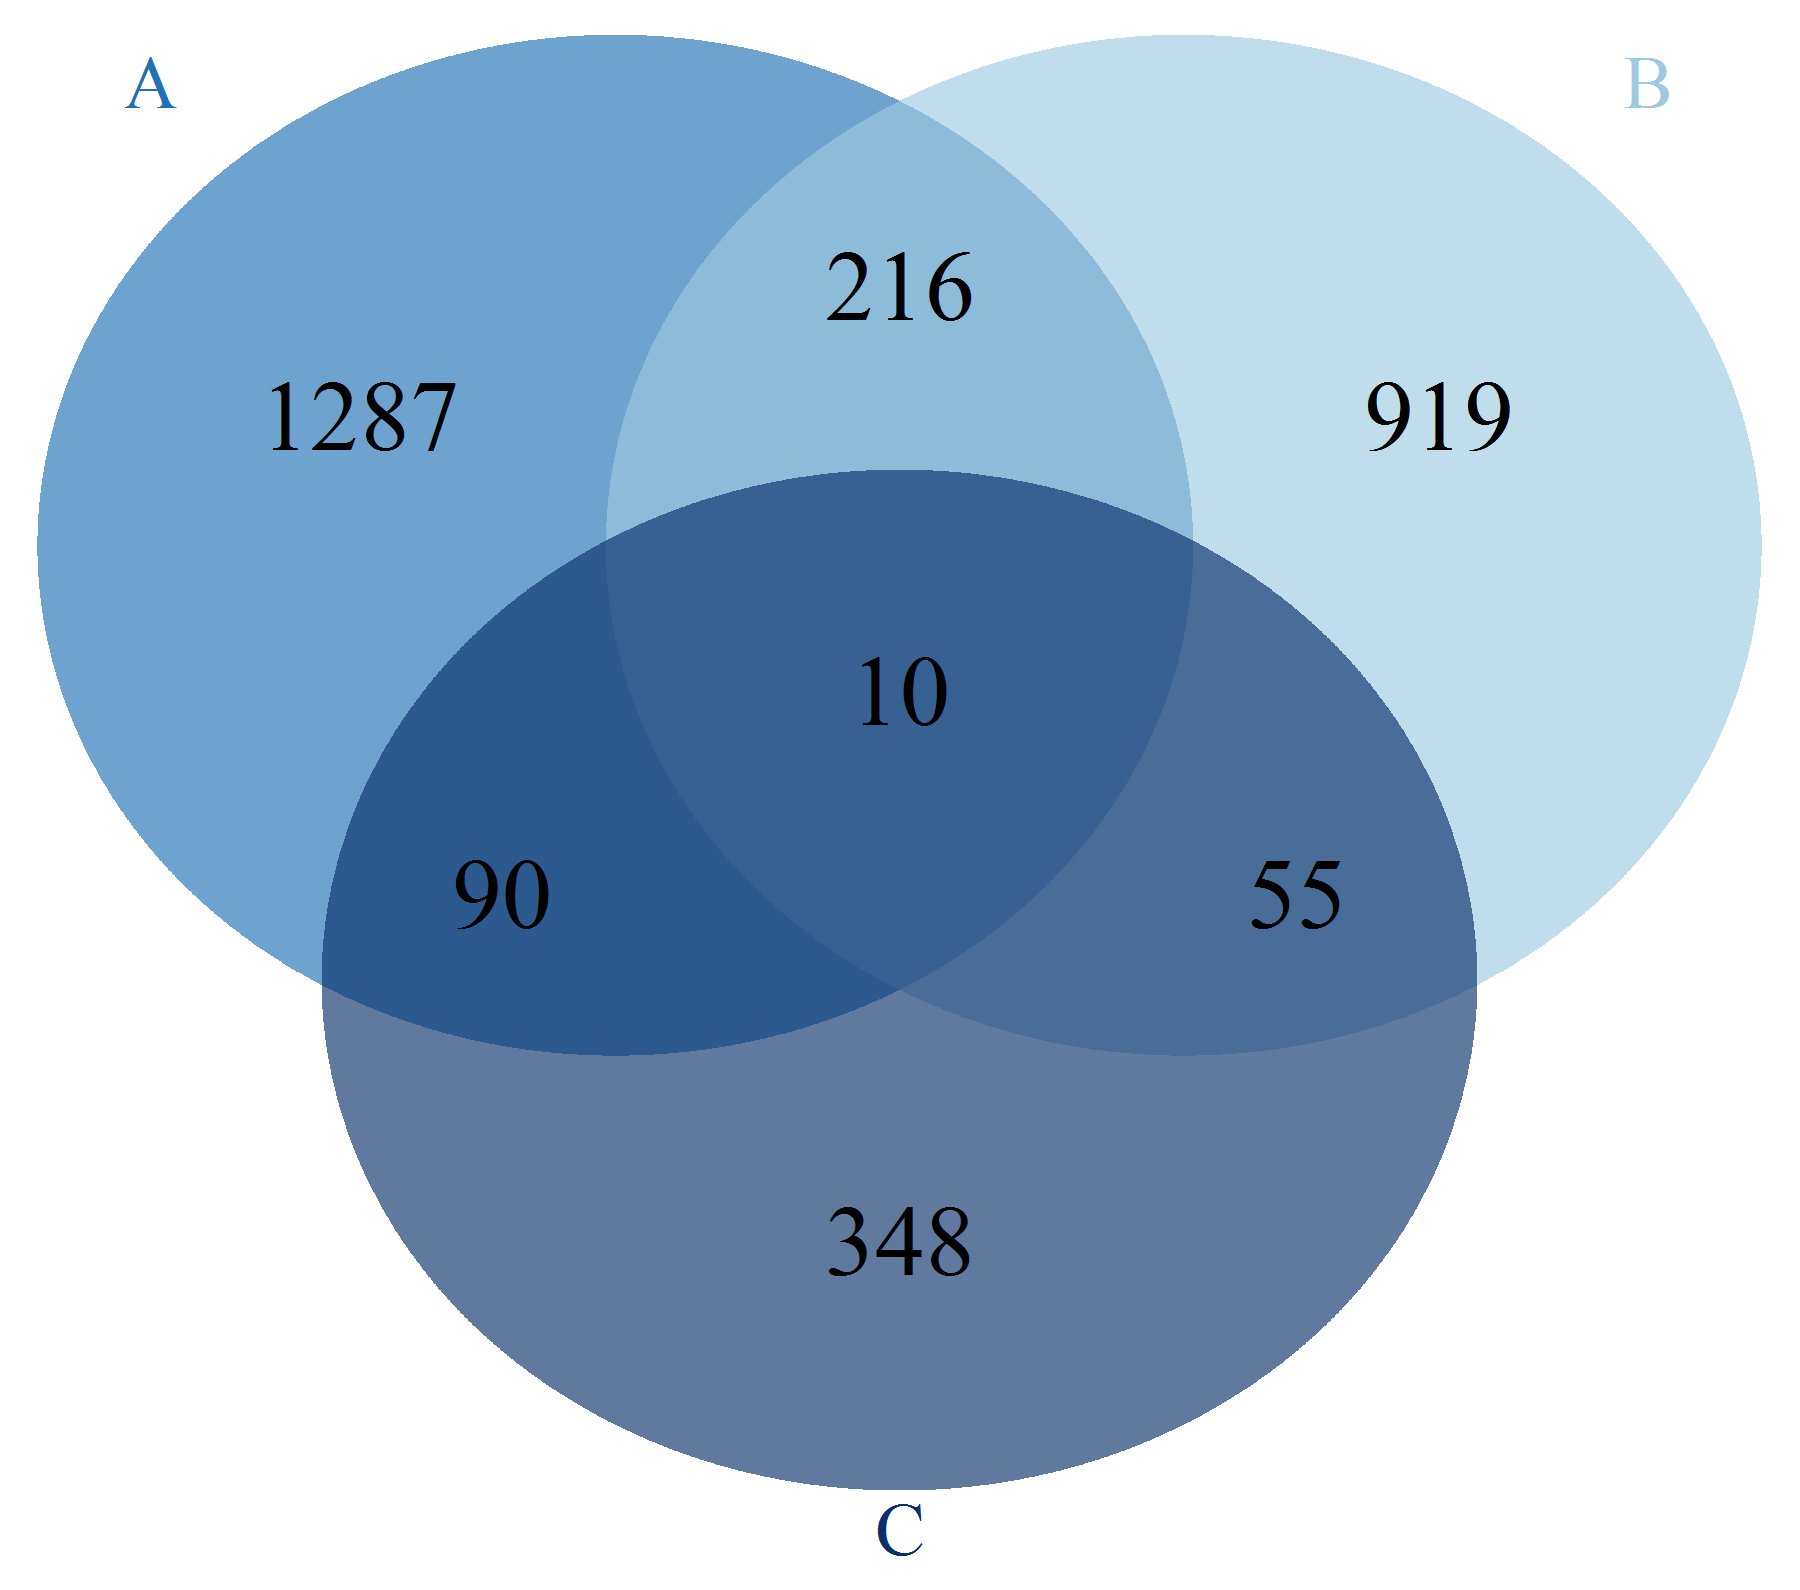
Venn diagram
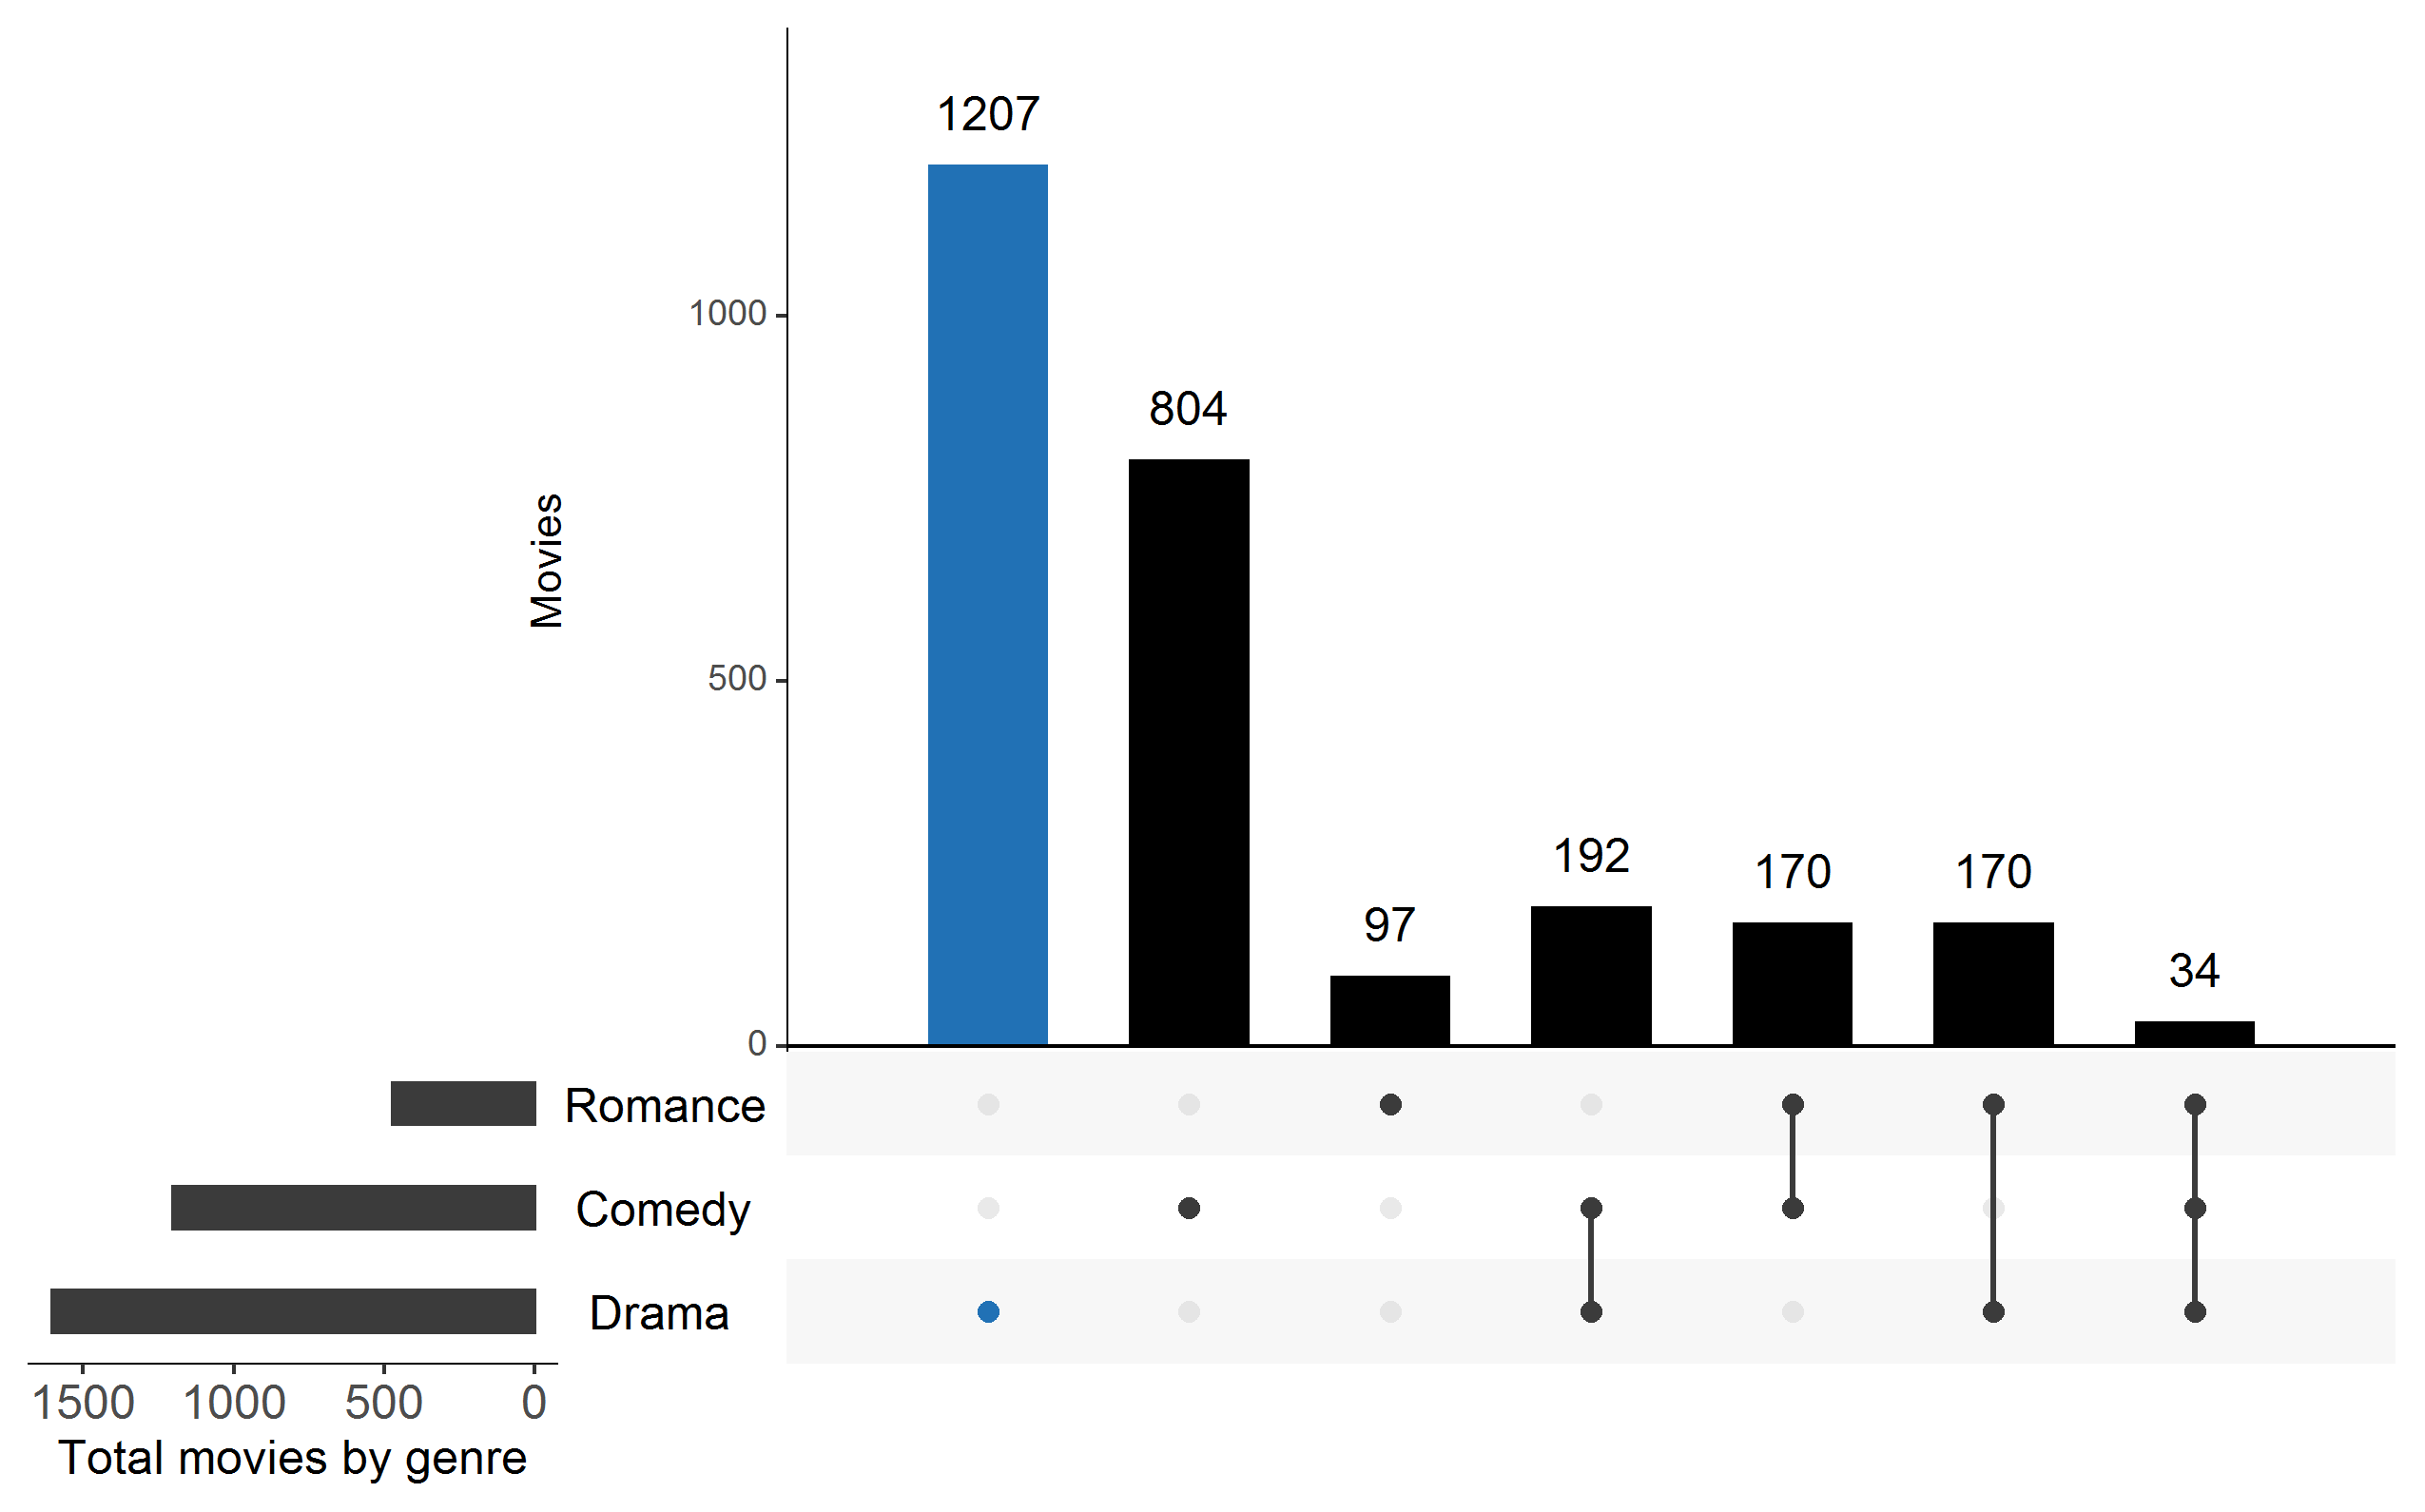
UpSet diagram
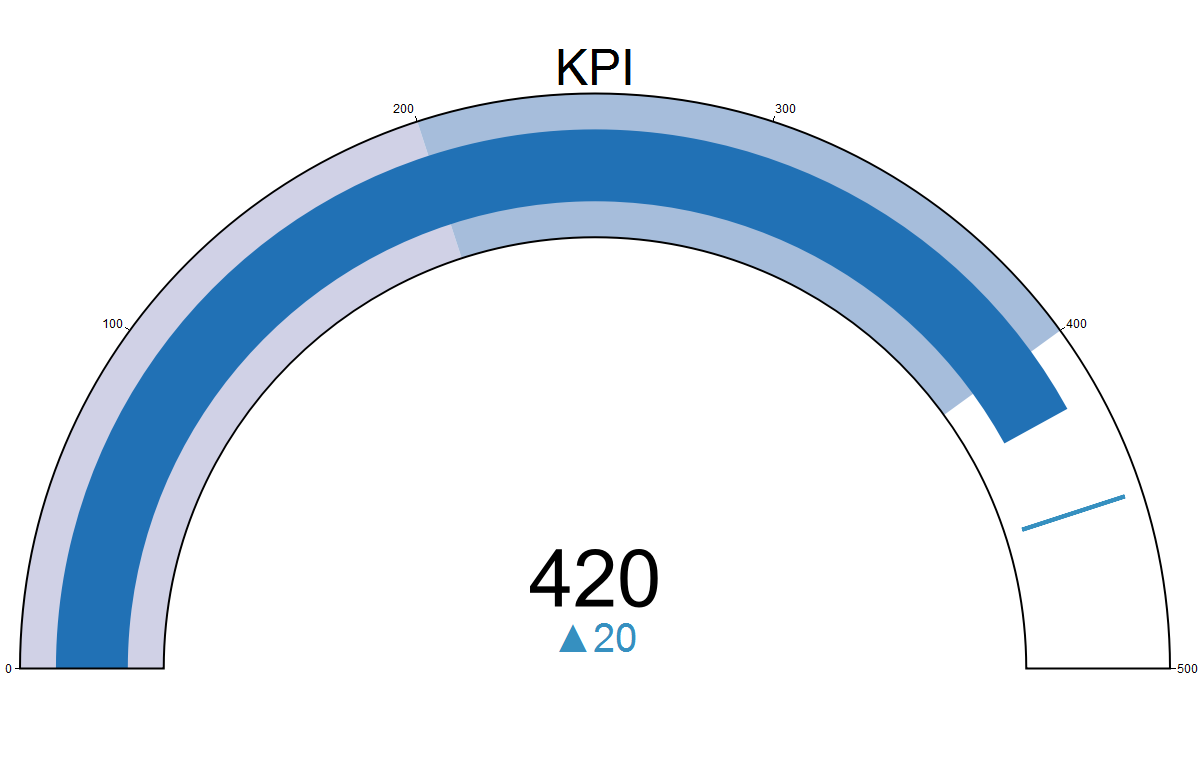
Gauge plot
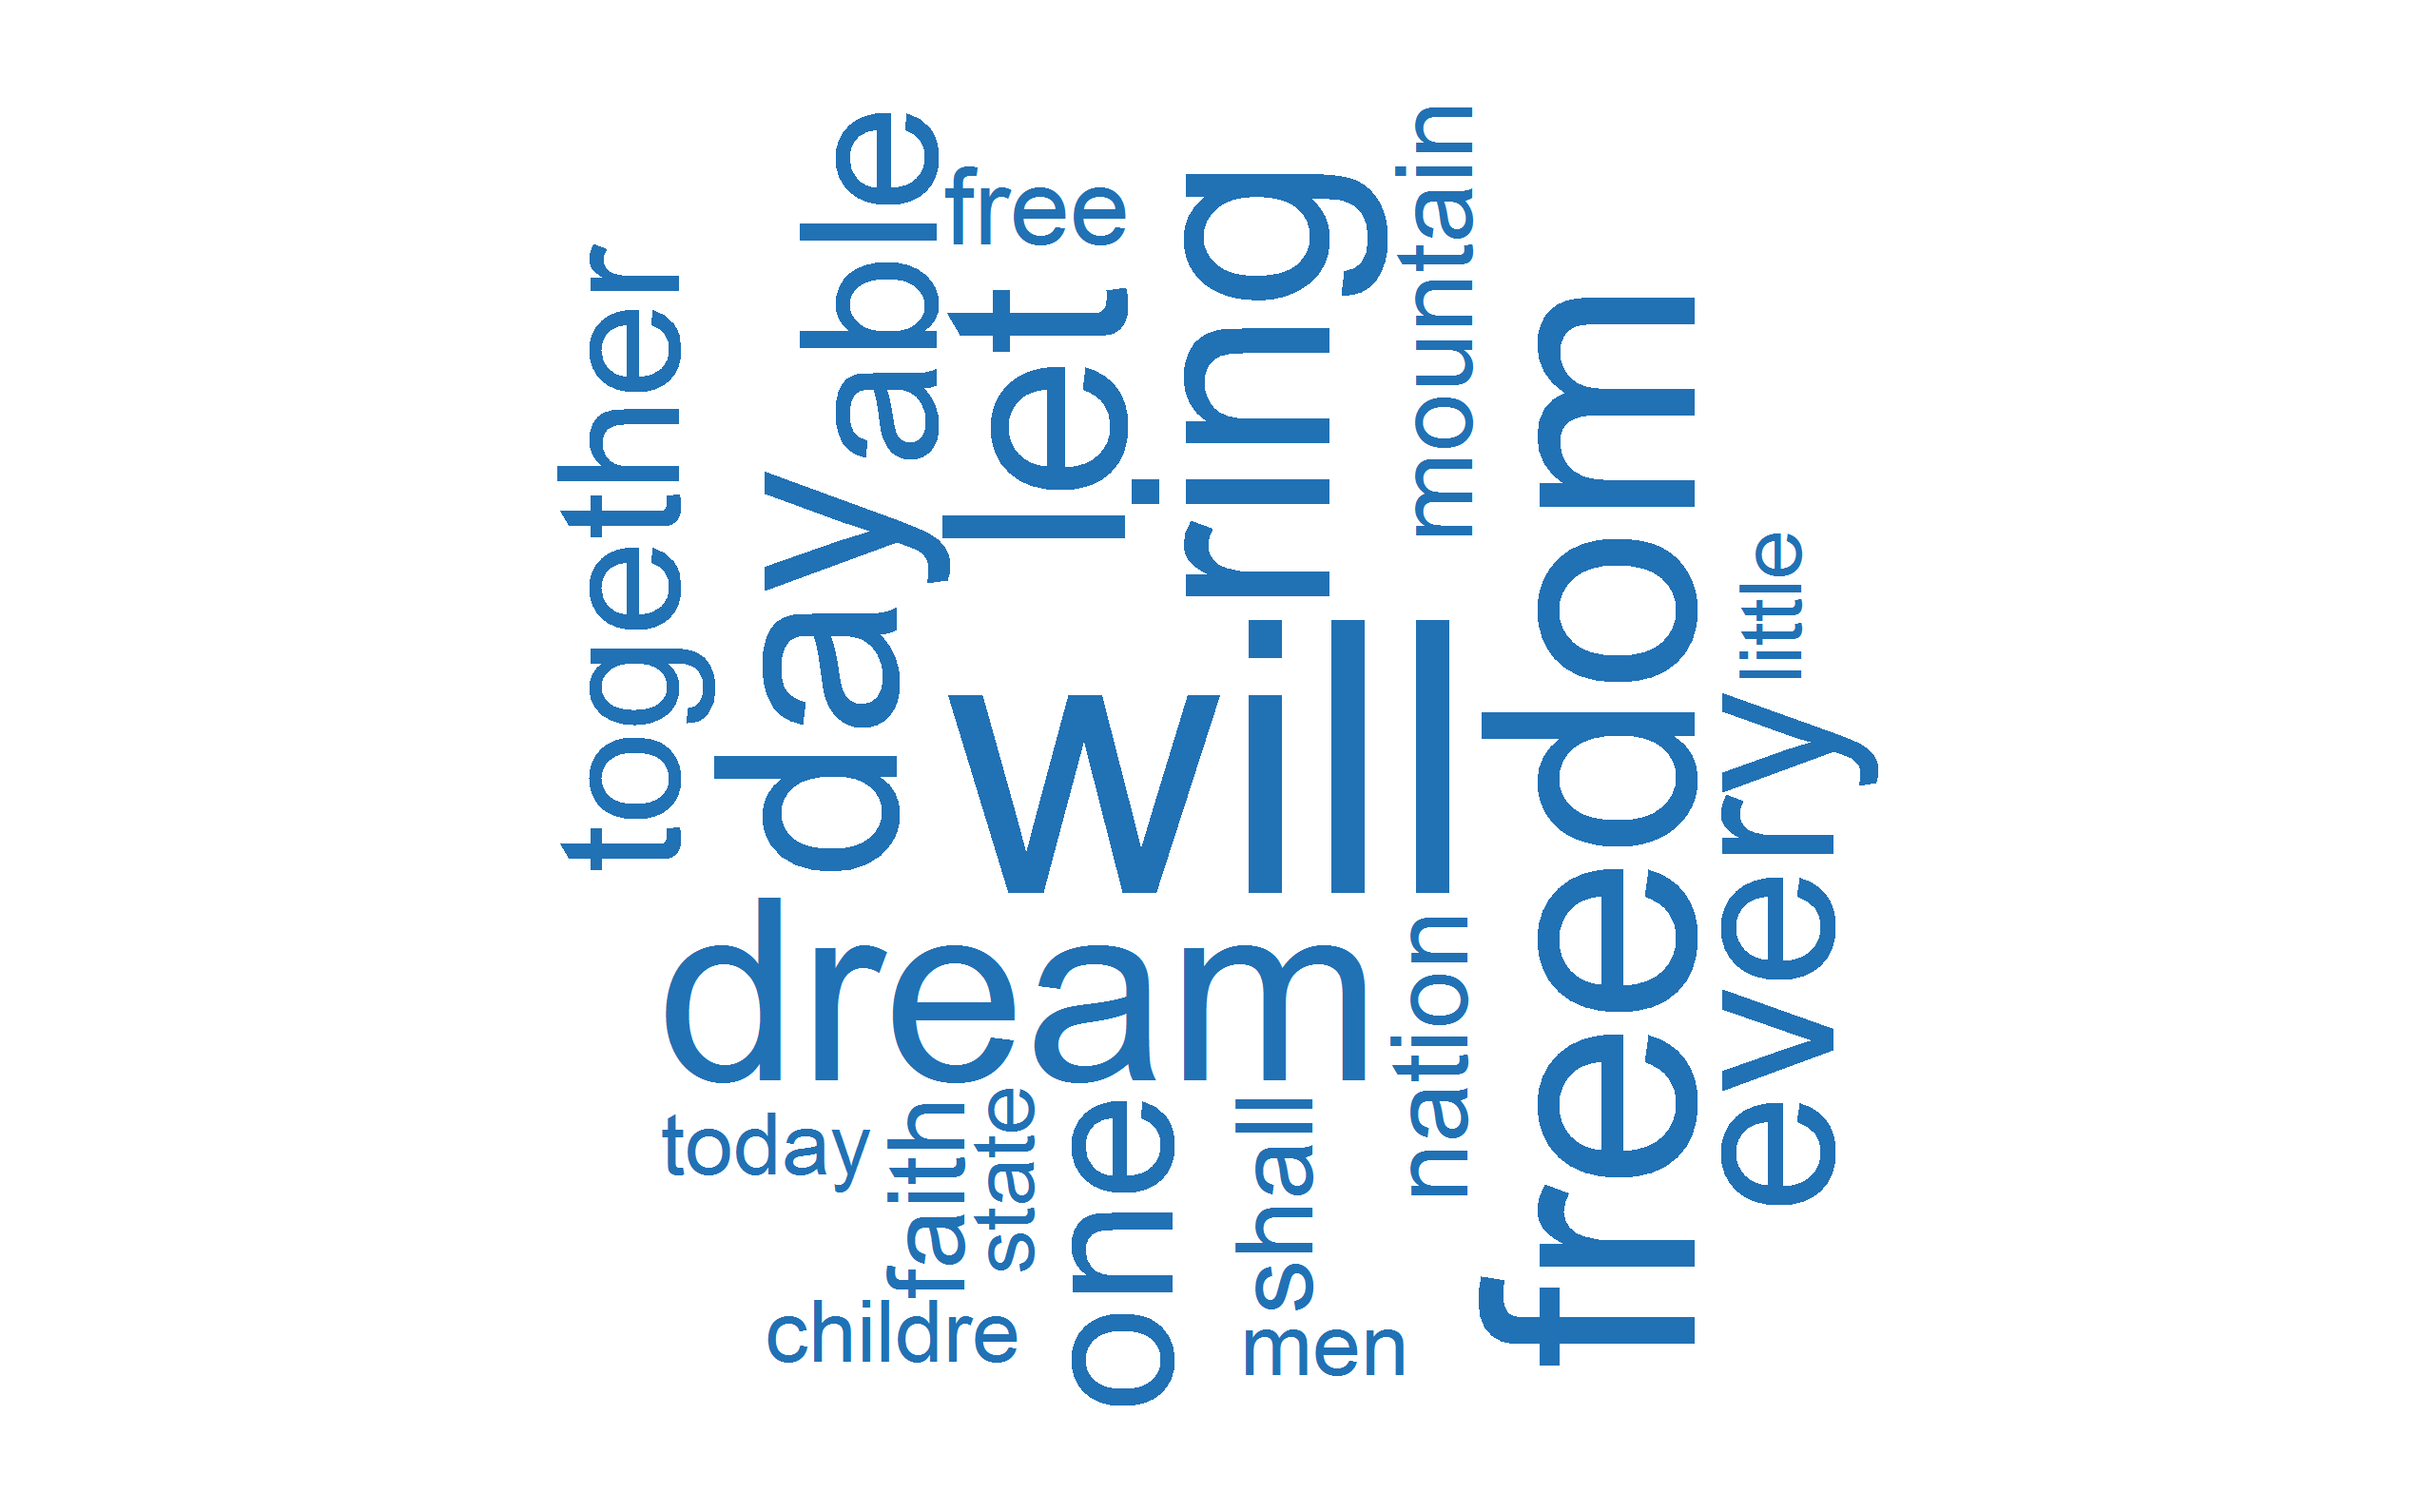
Wordcloud
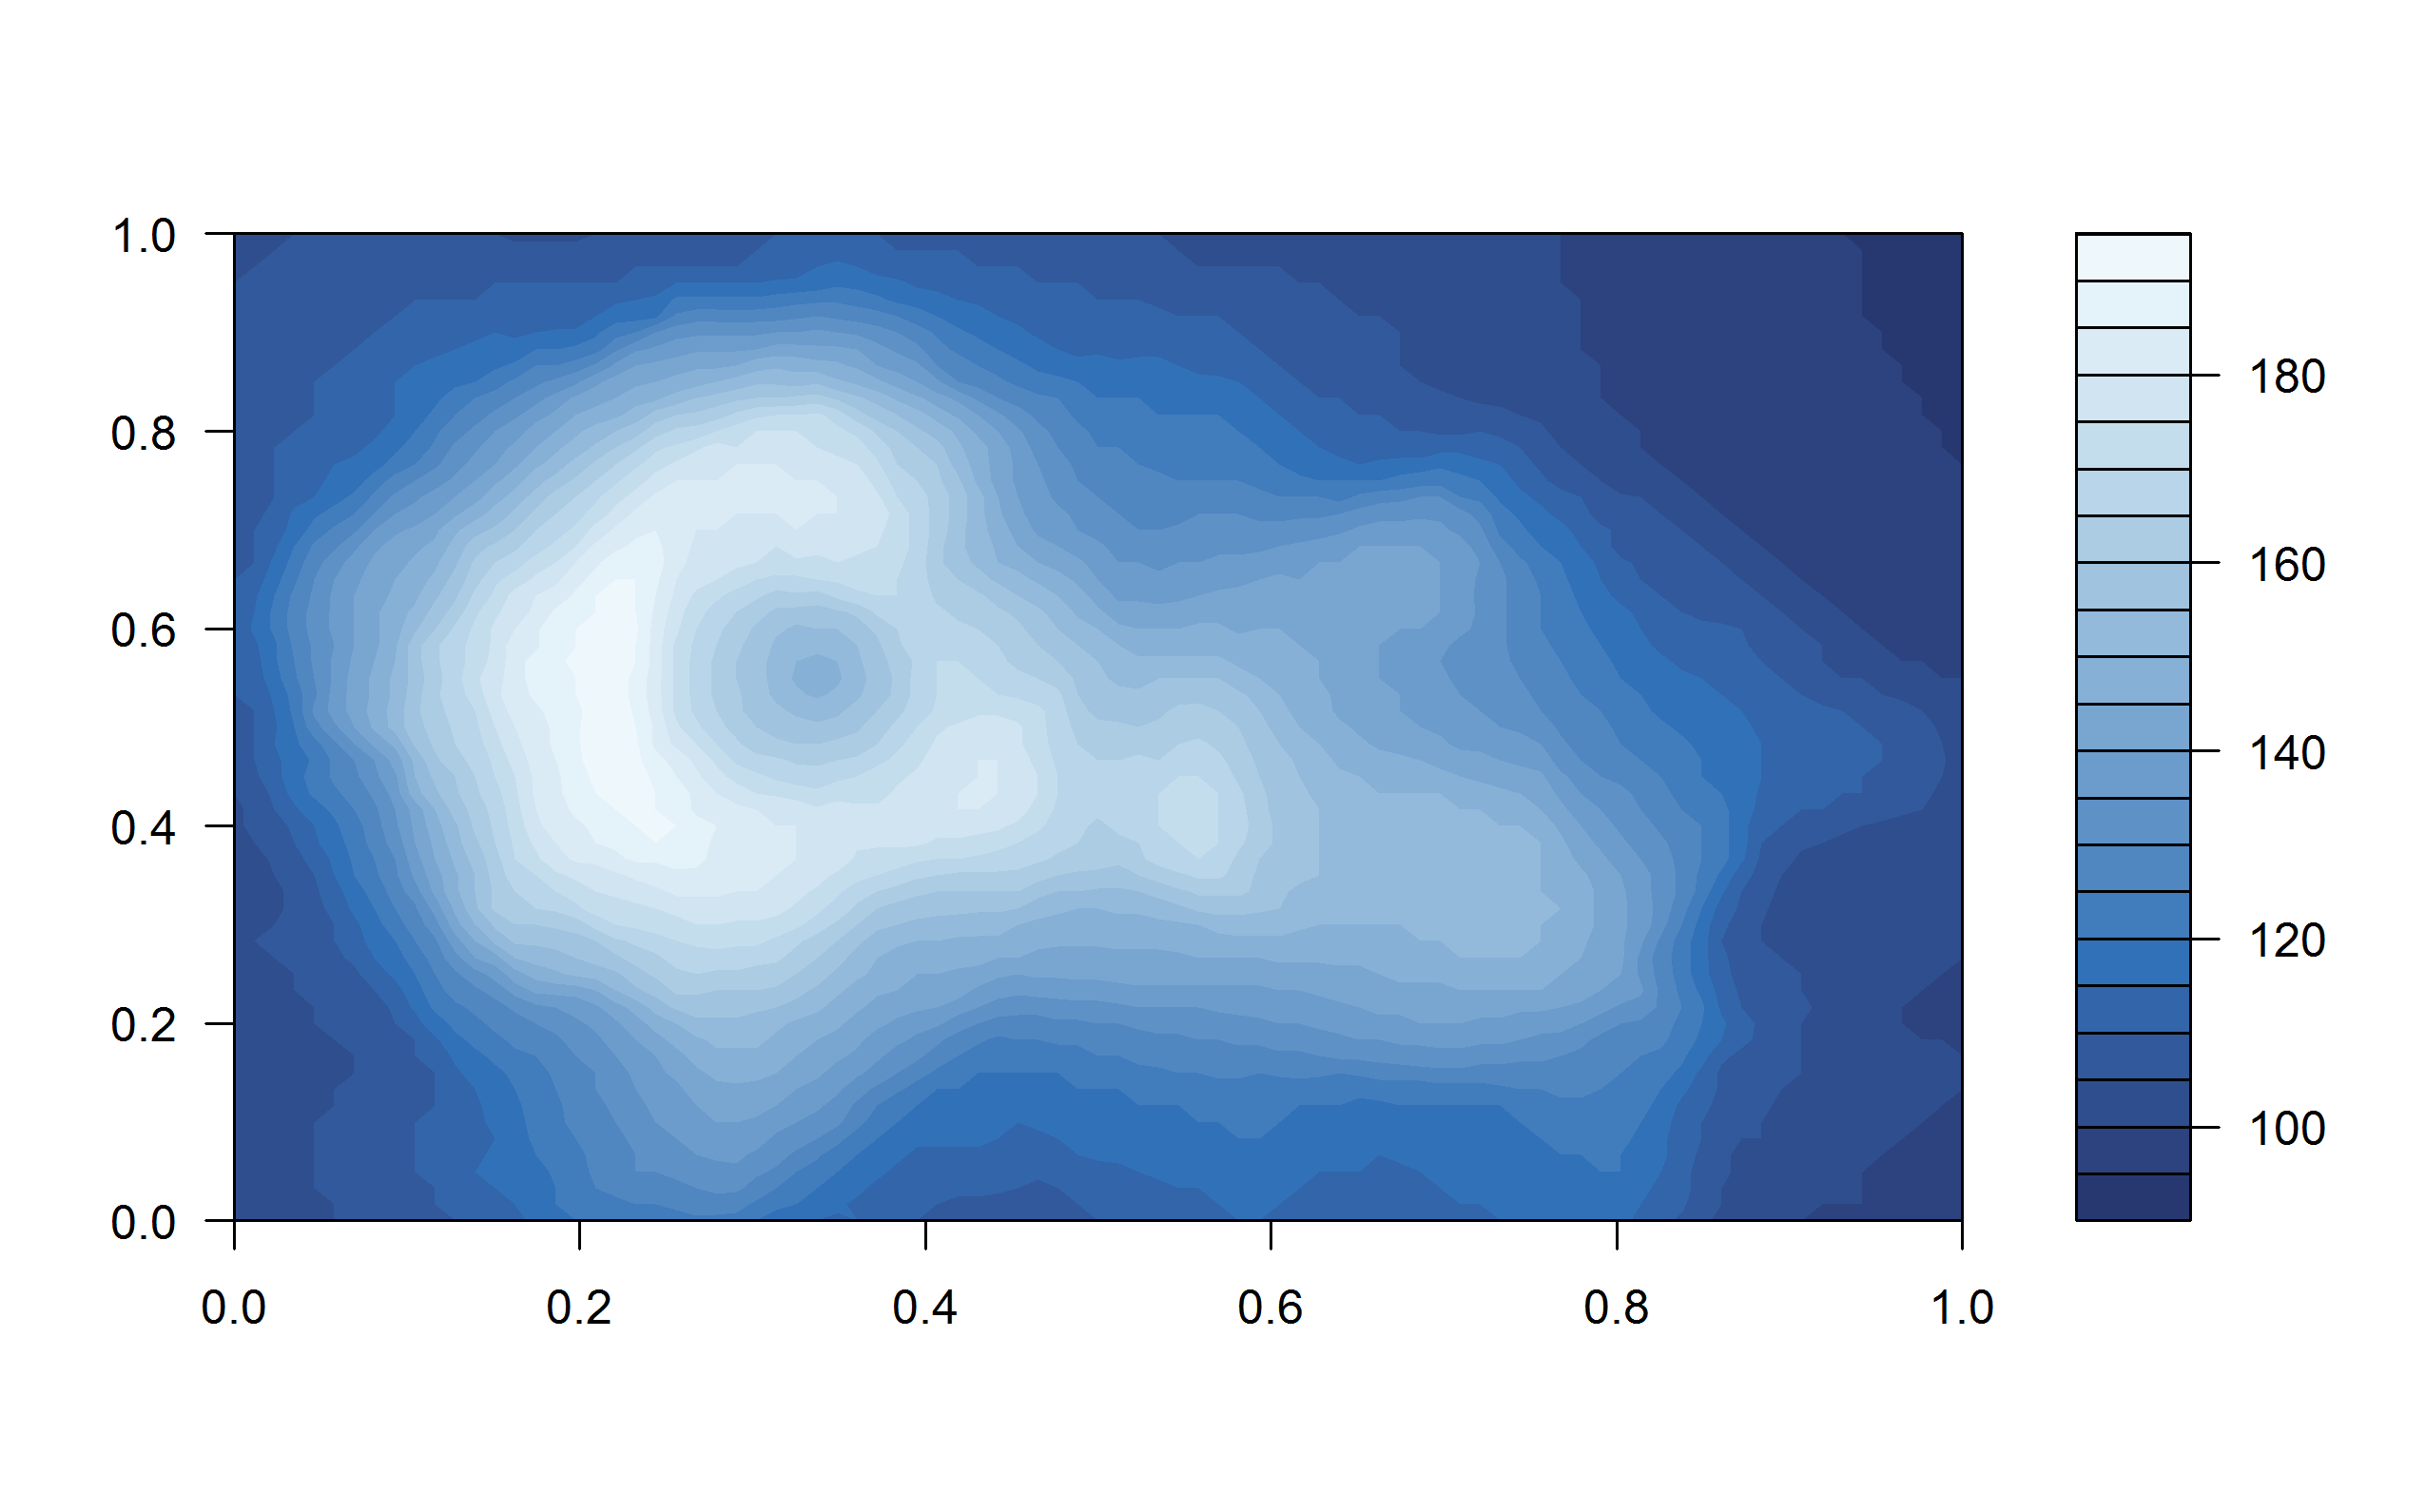
Contour
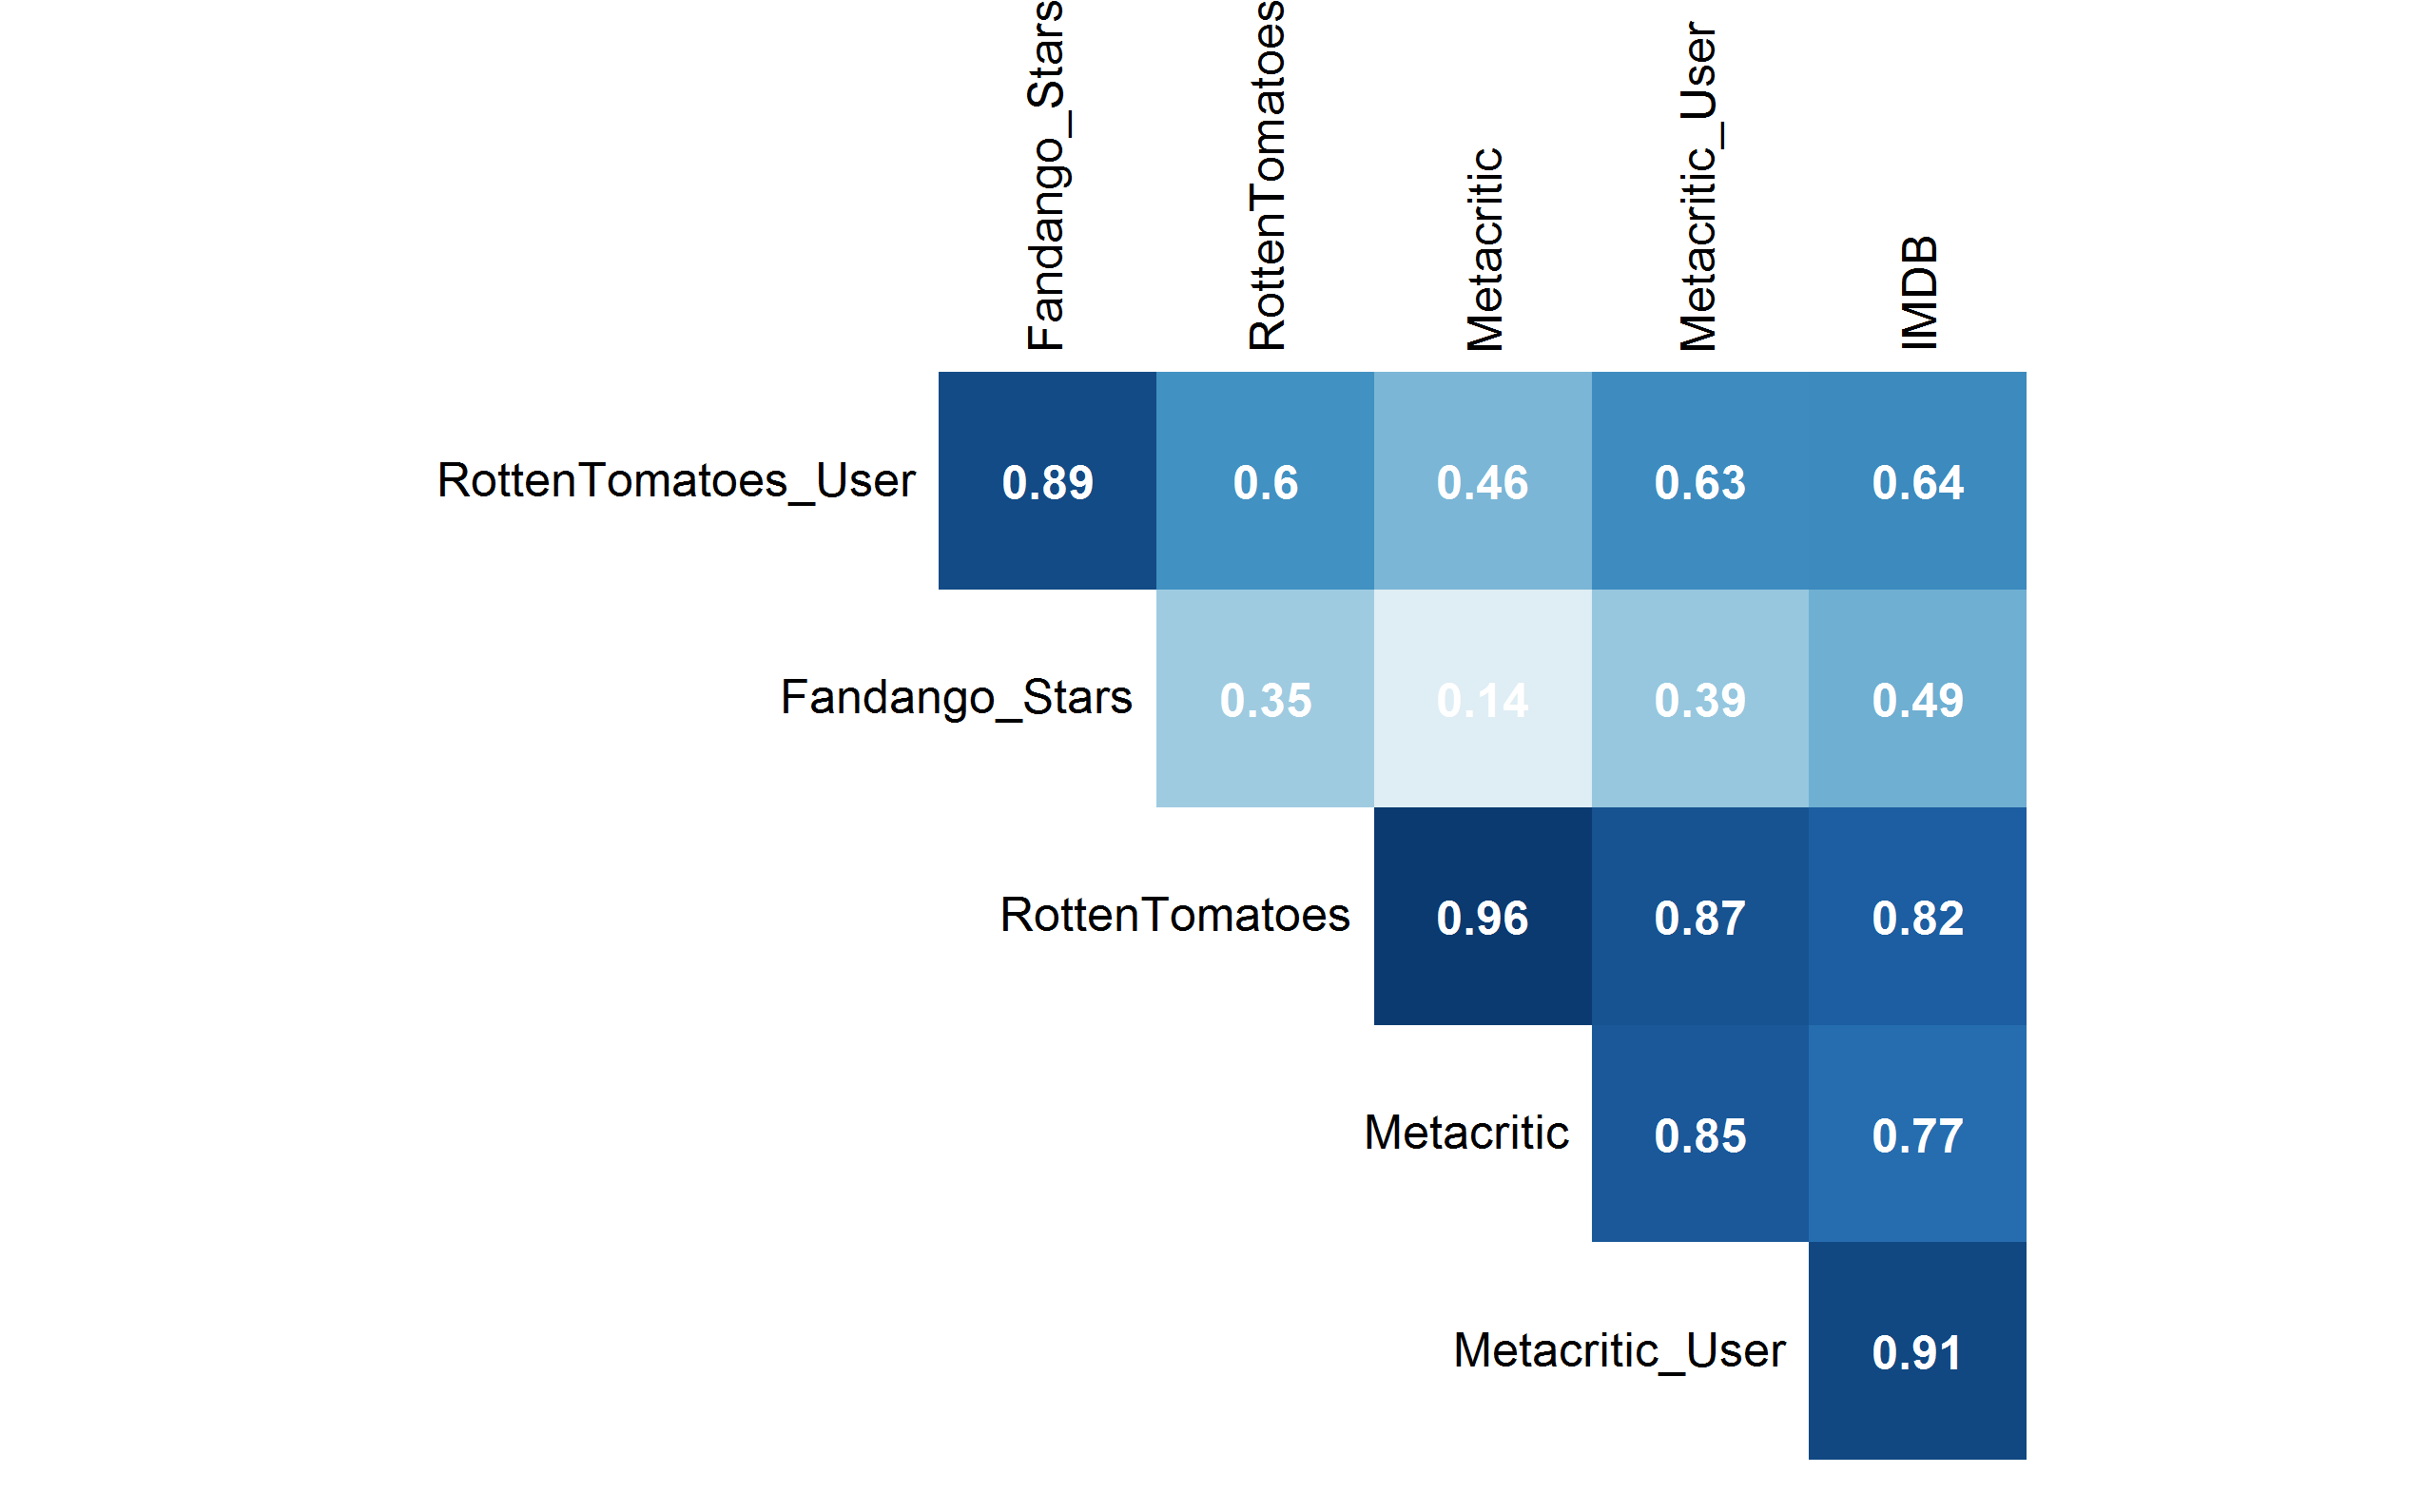
Corrplot
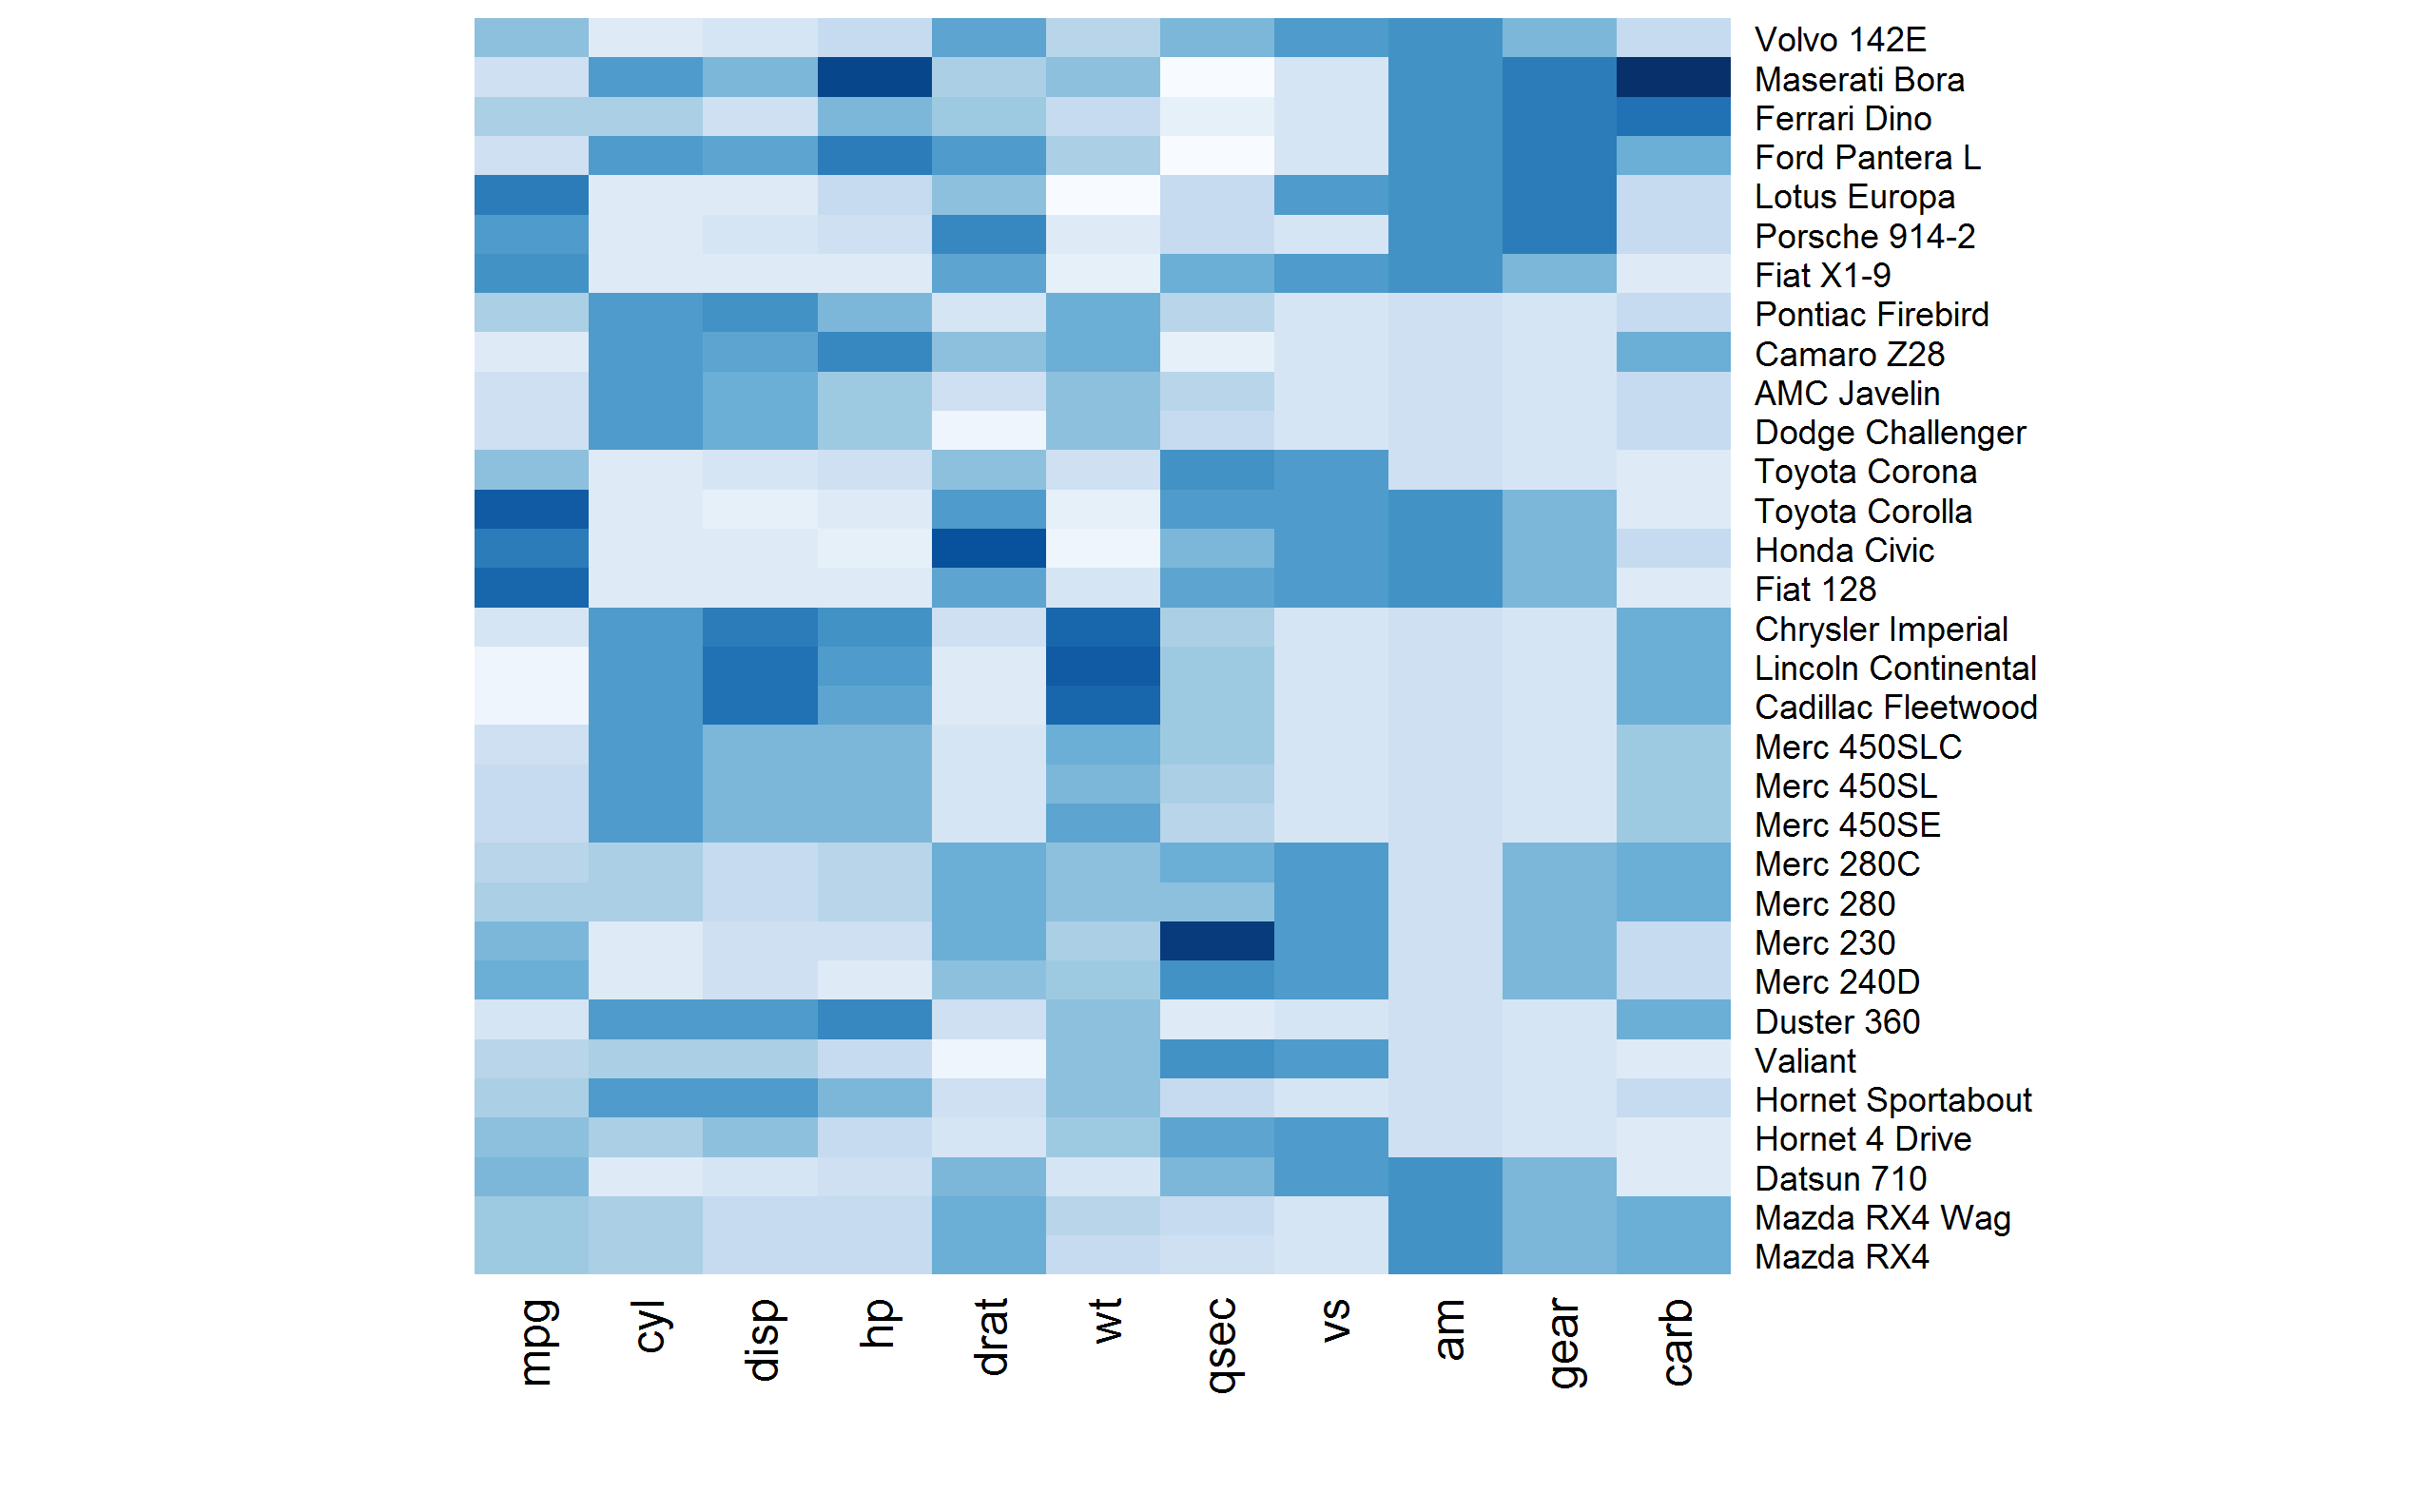
Heatmap
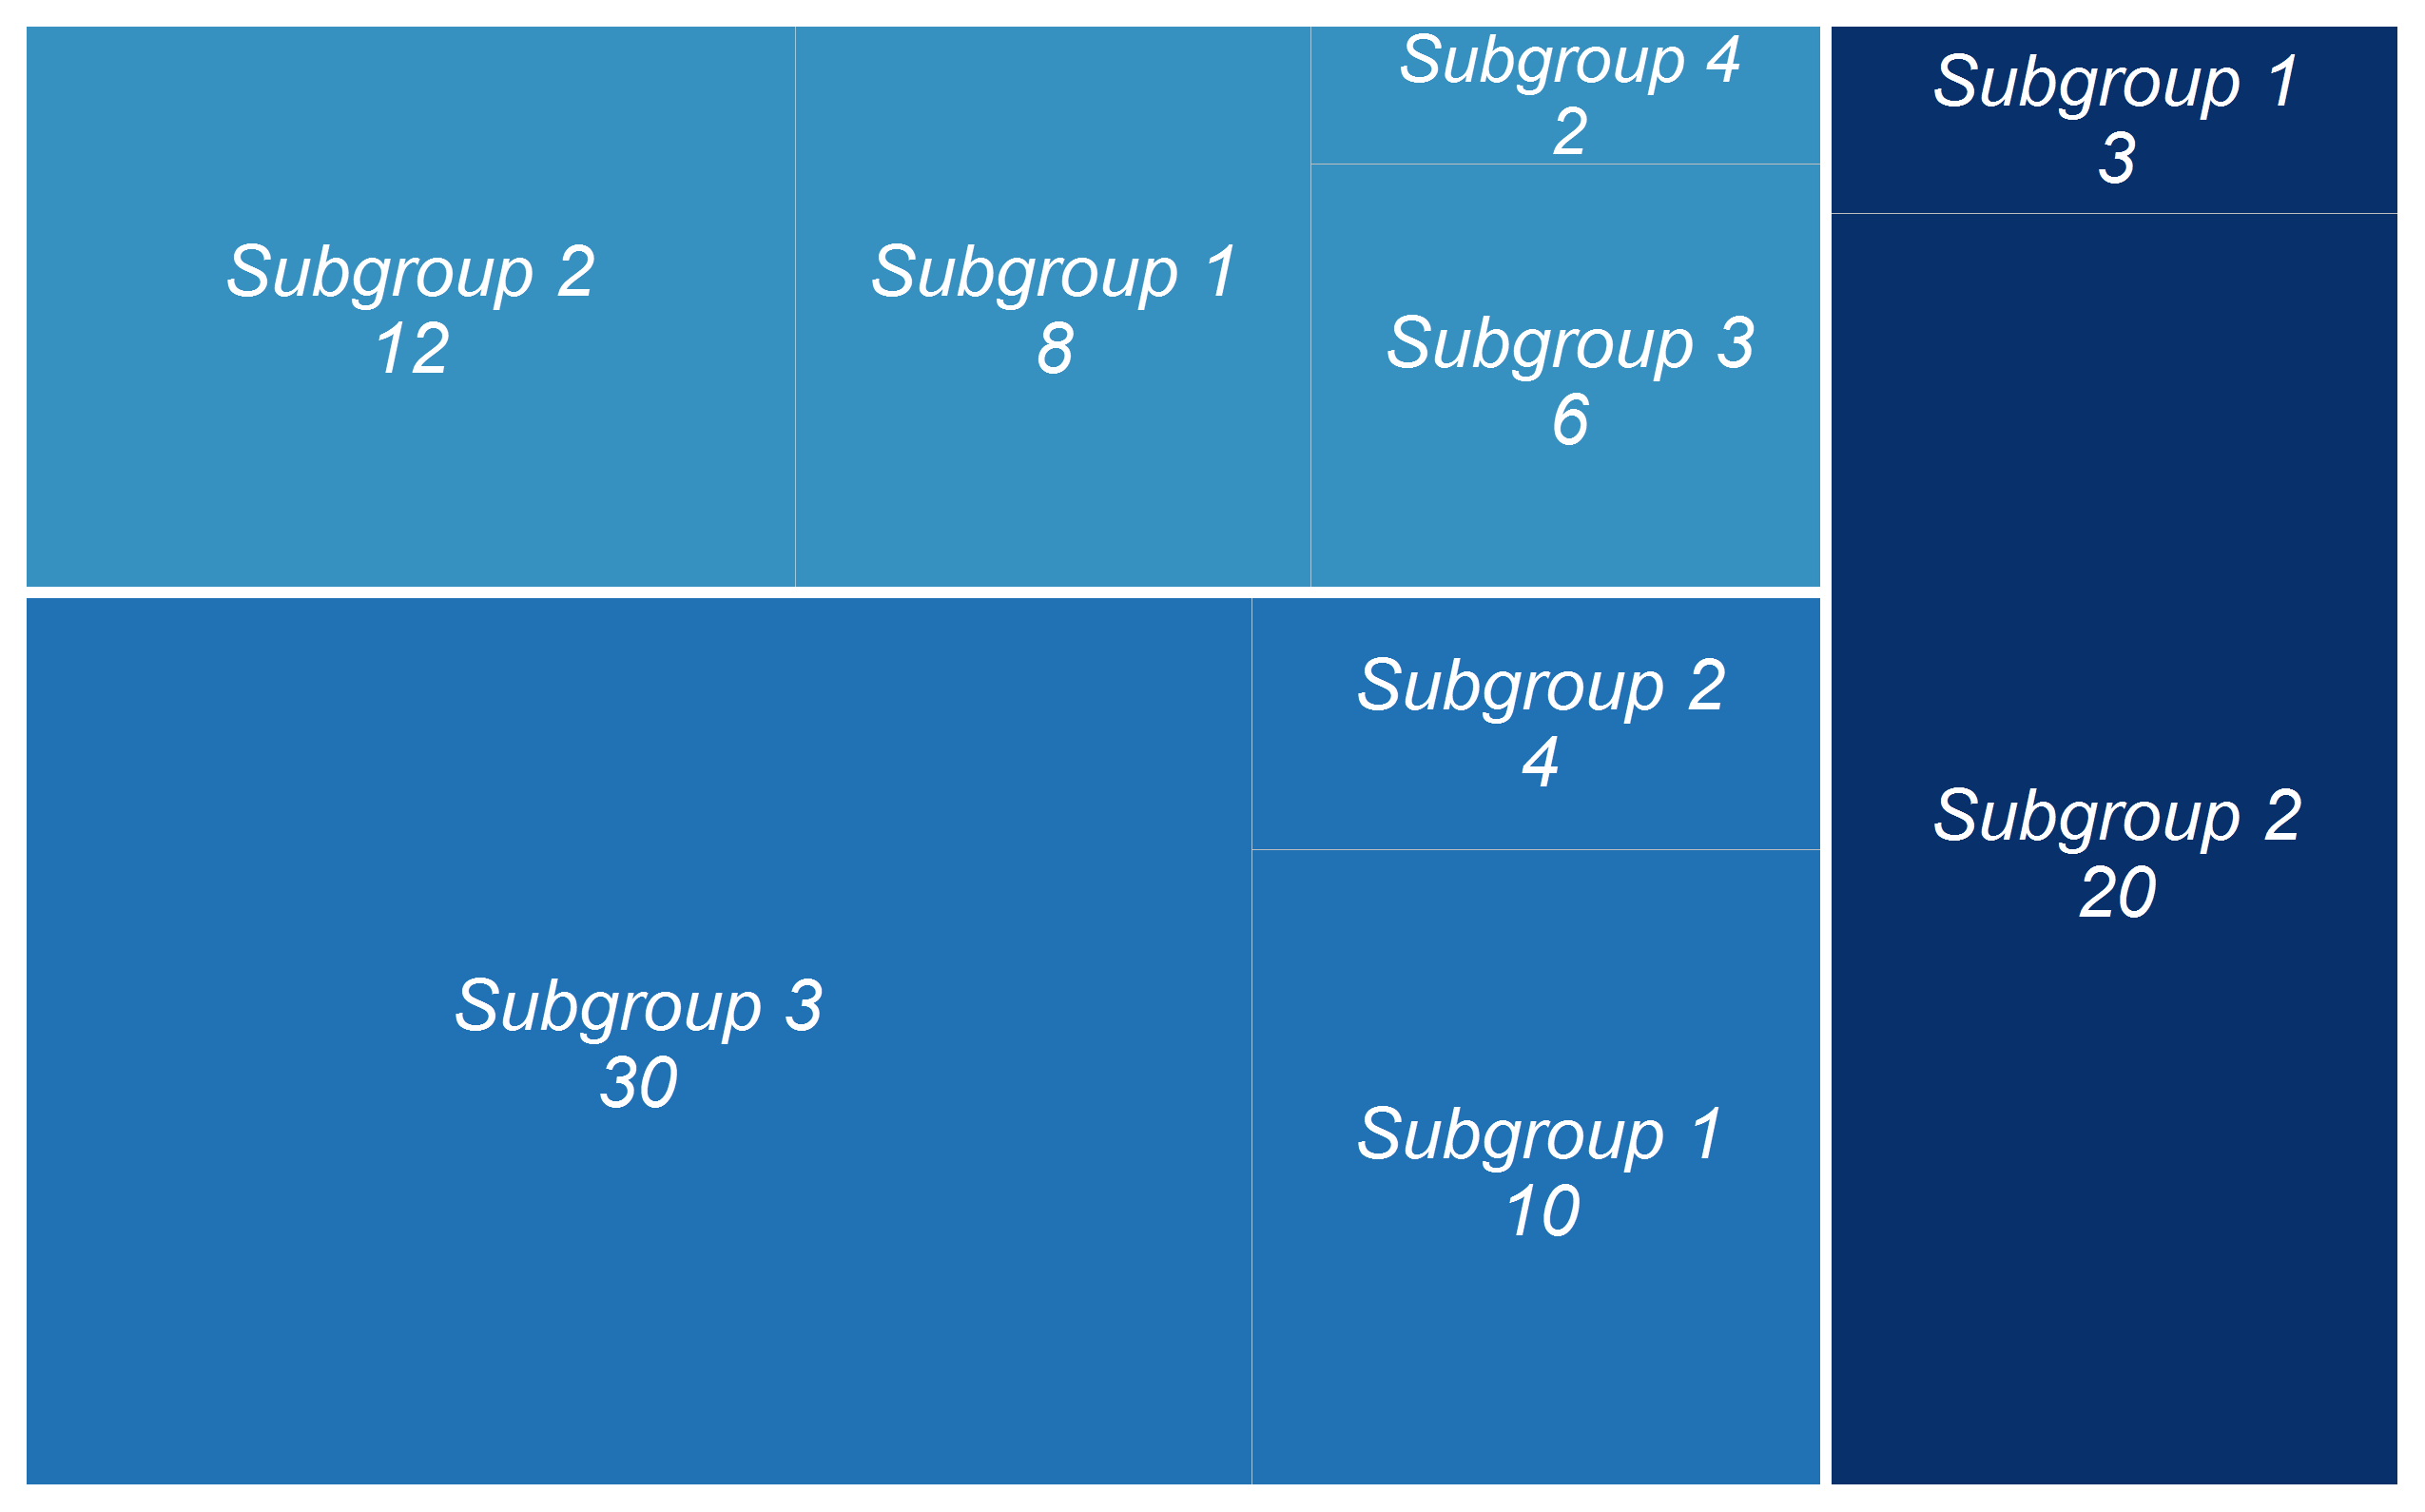
Treemap plot
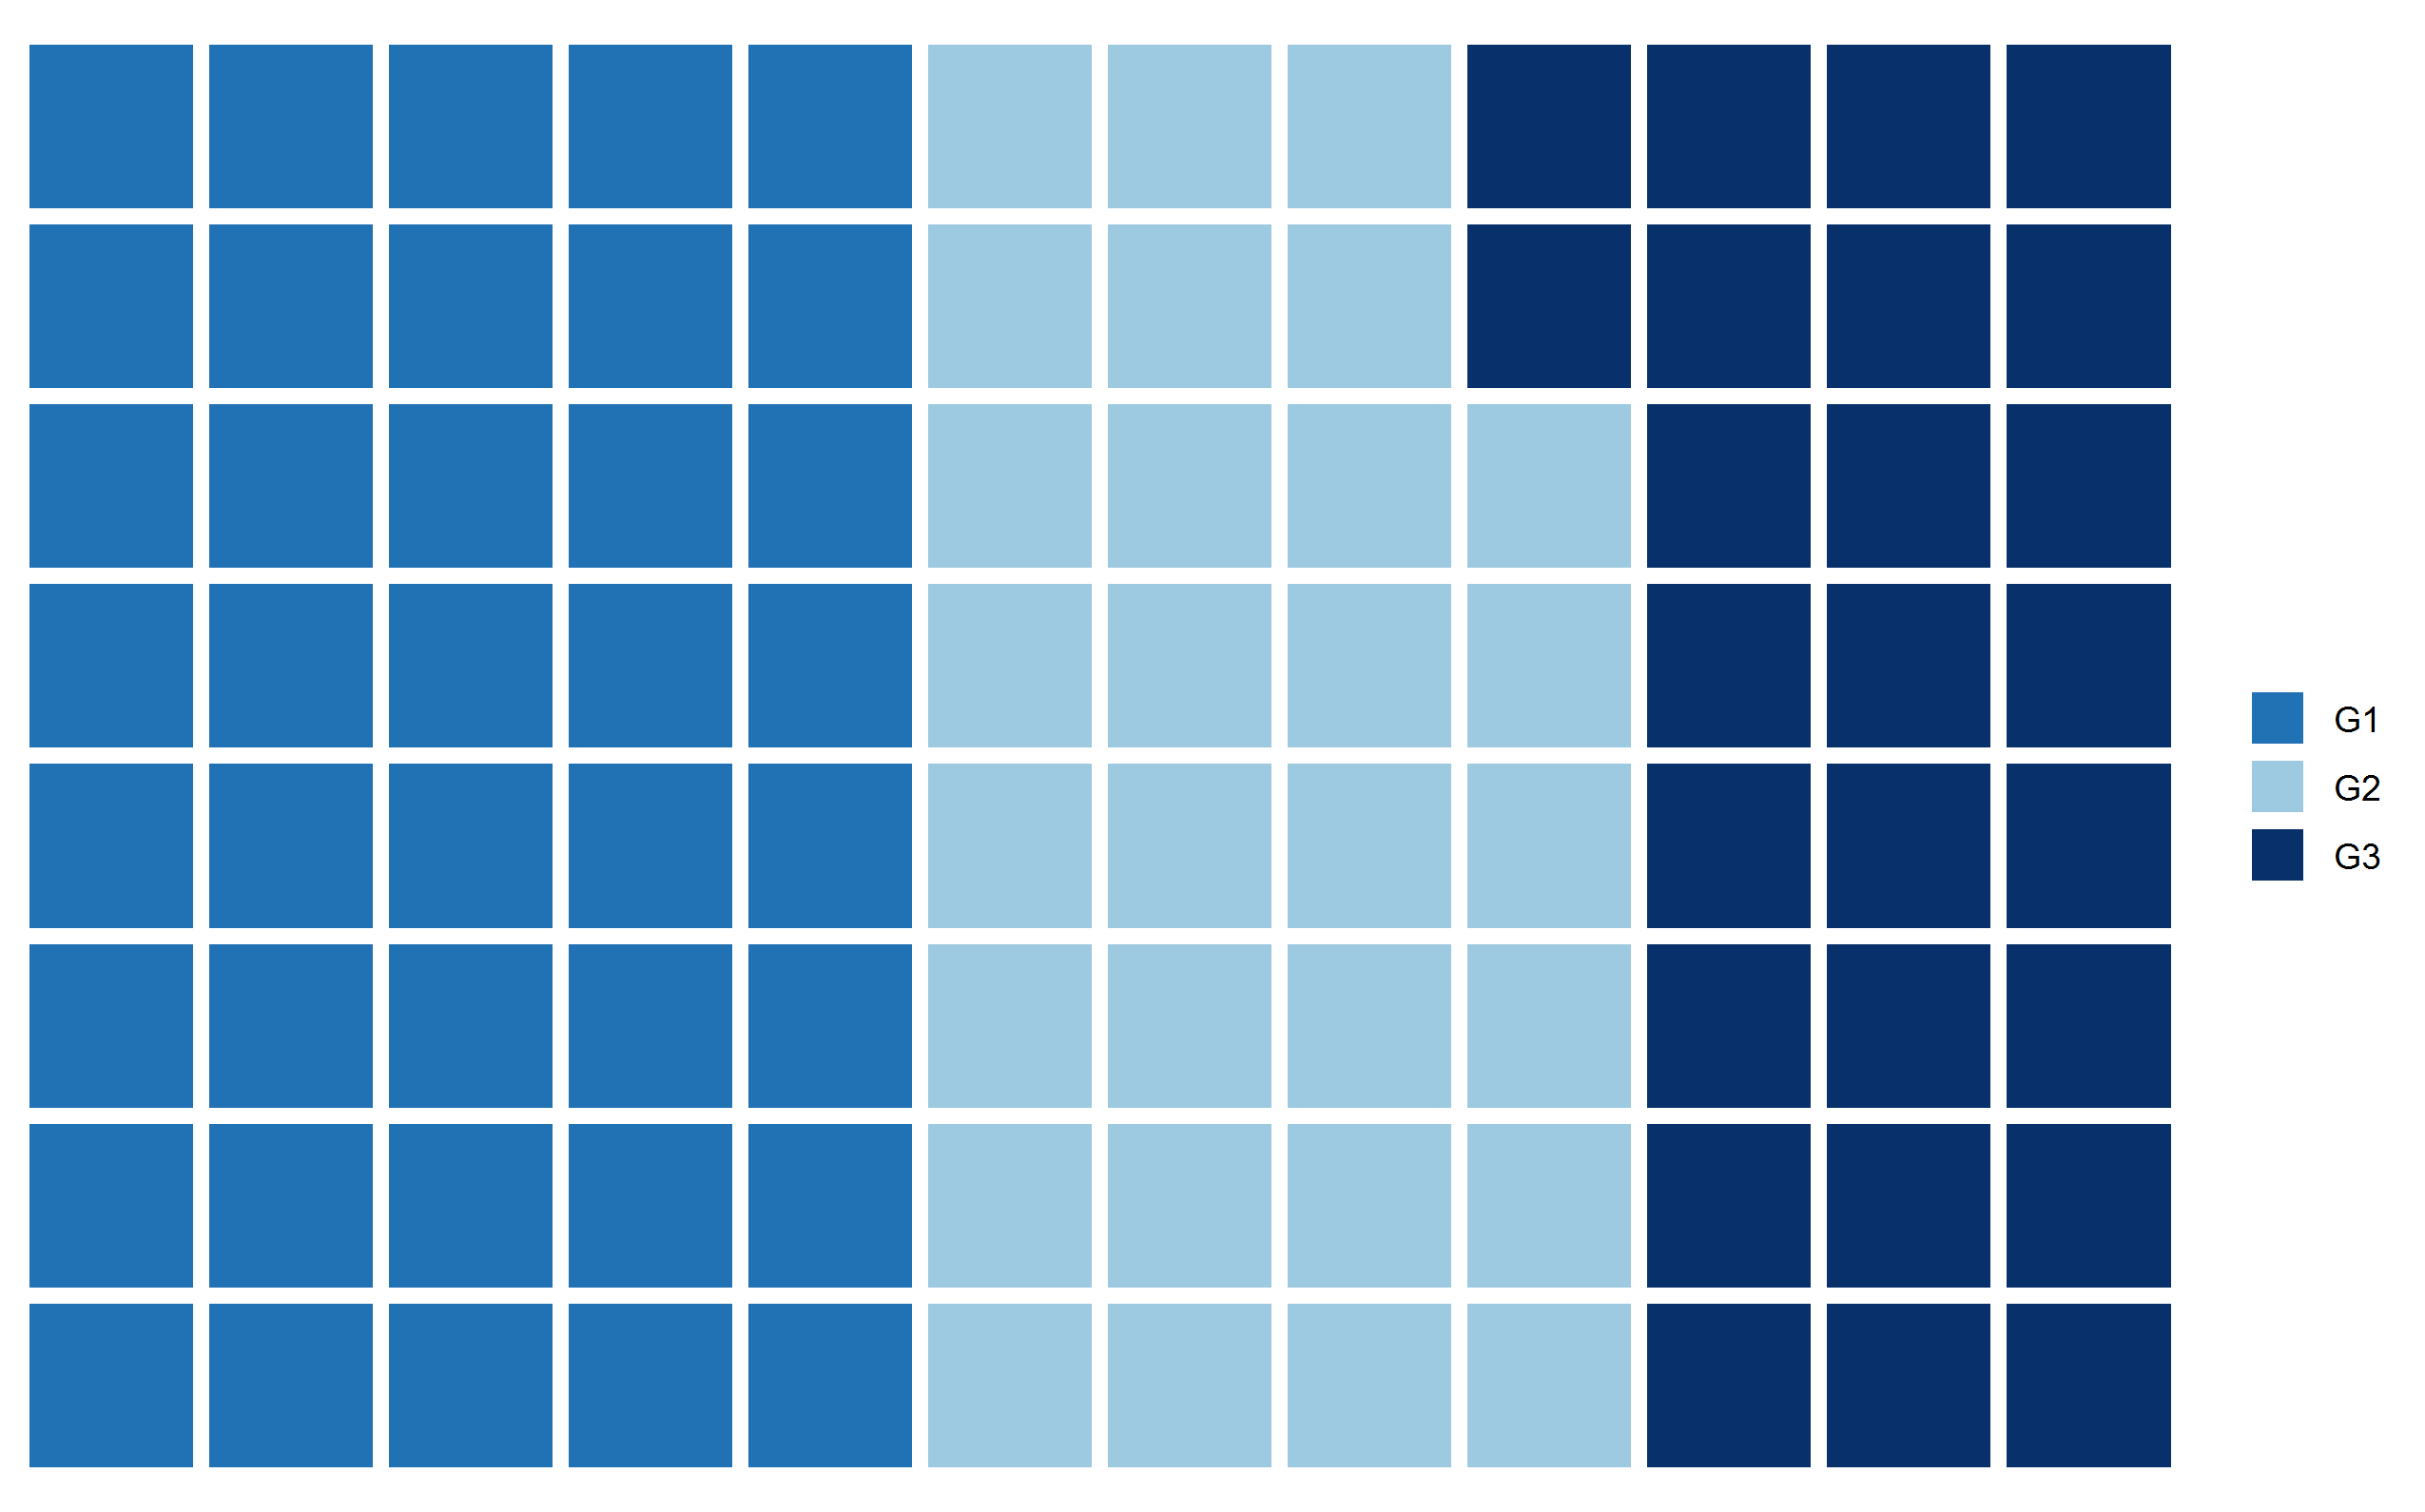
Waffle plot
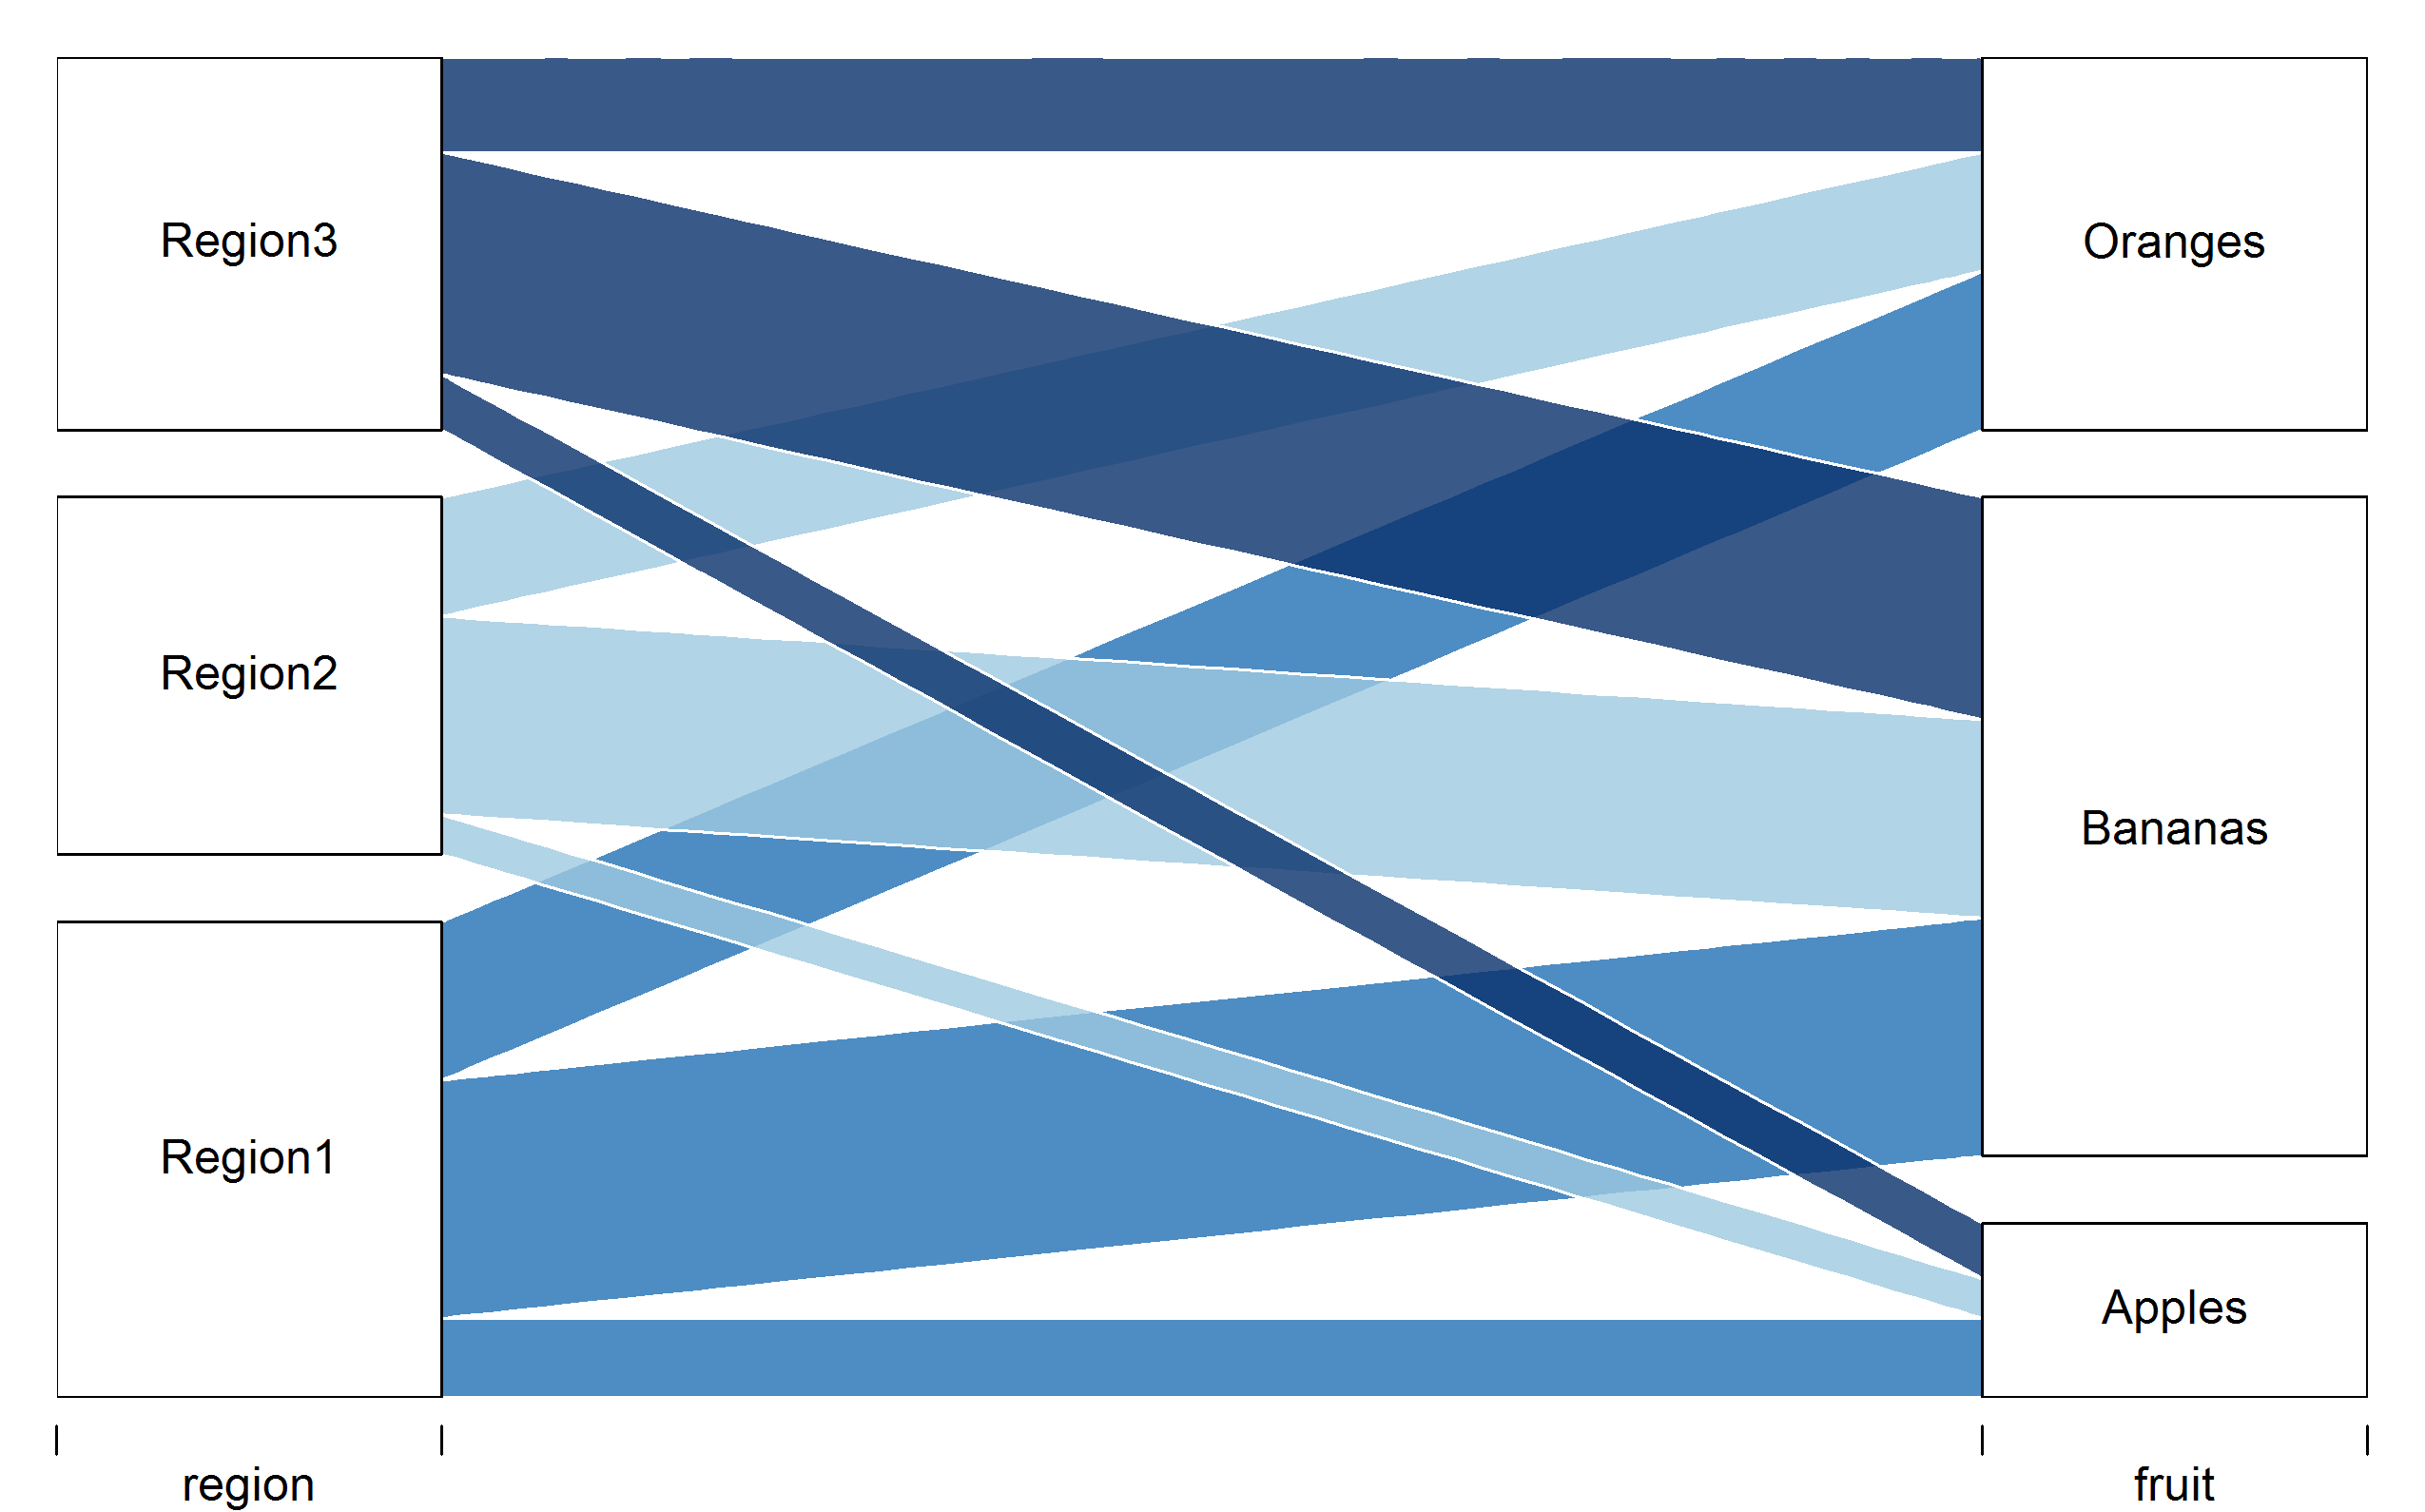
Alluvial plot
Scatterplot
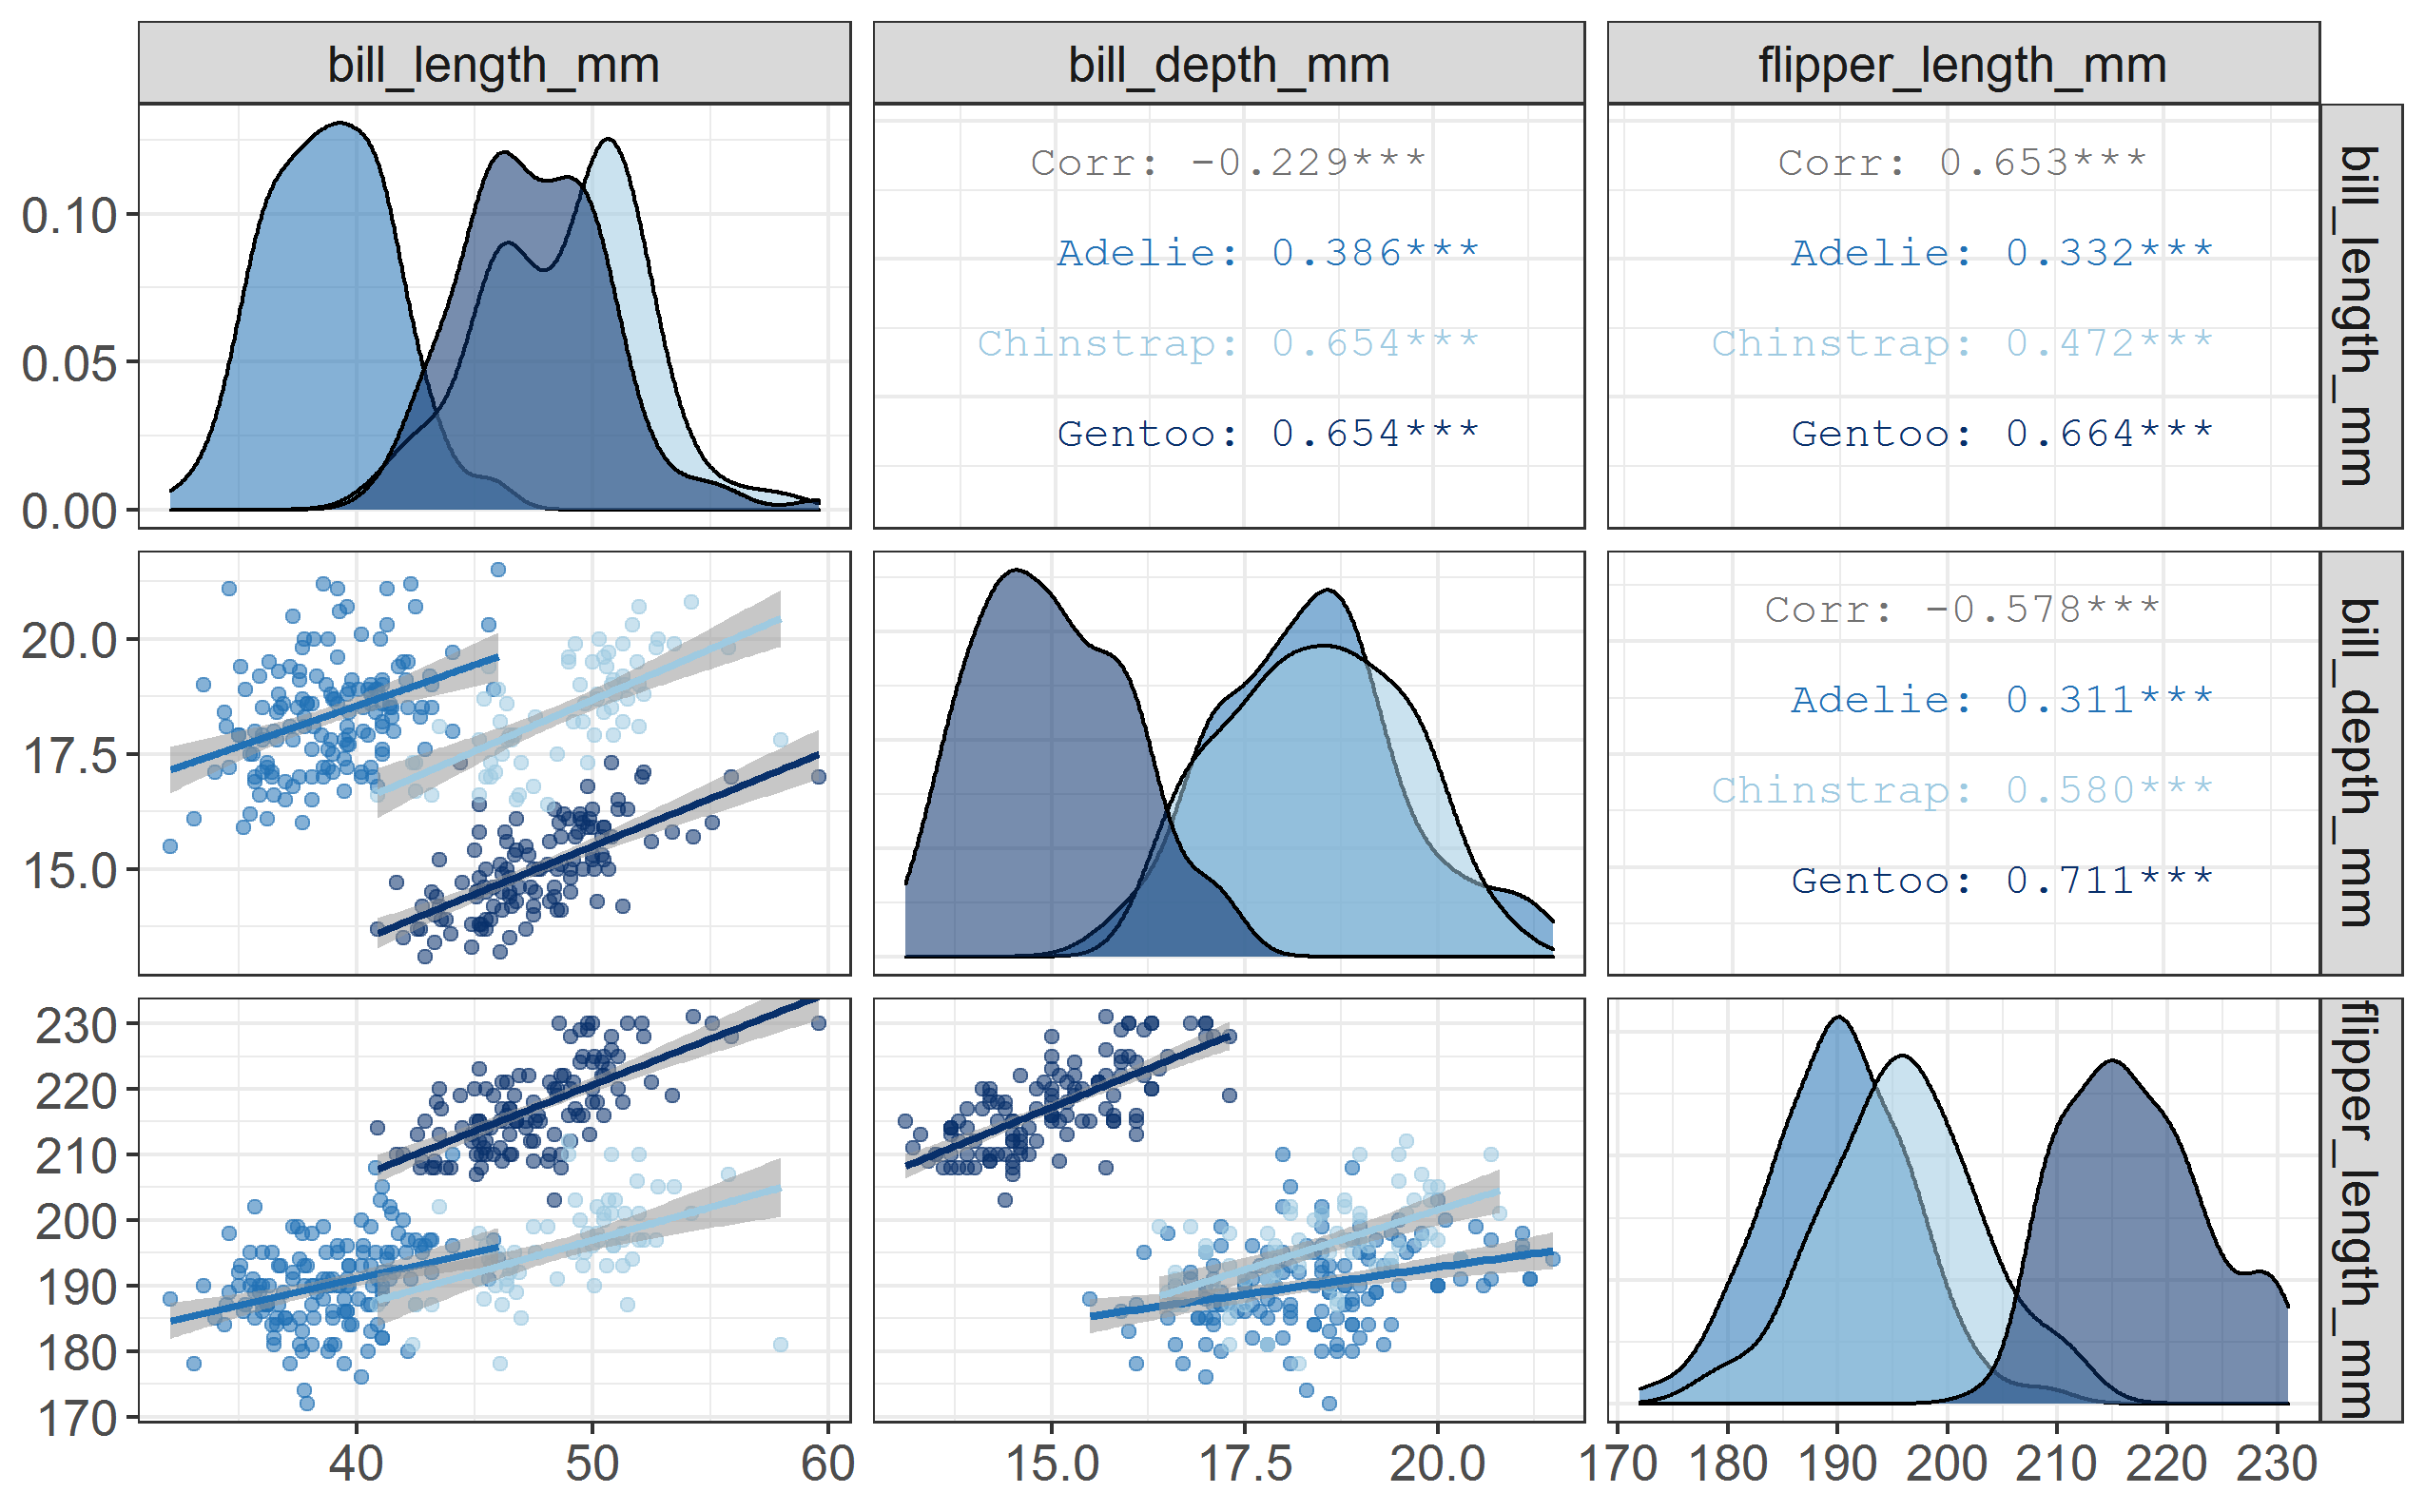
Pairplot
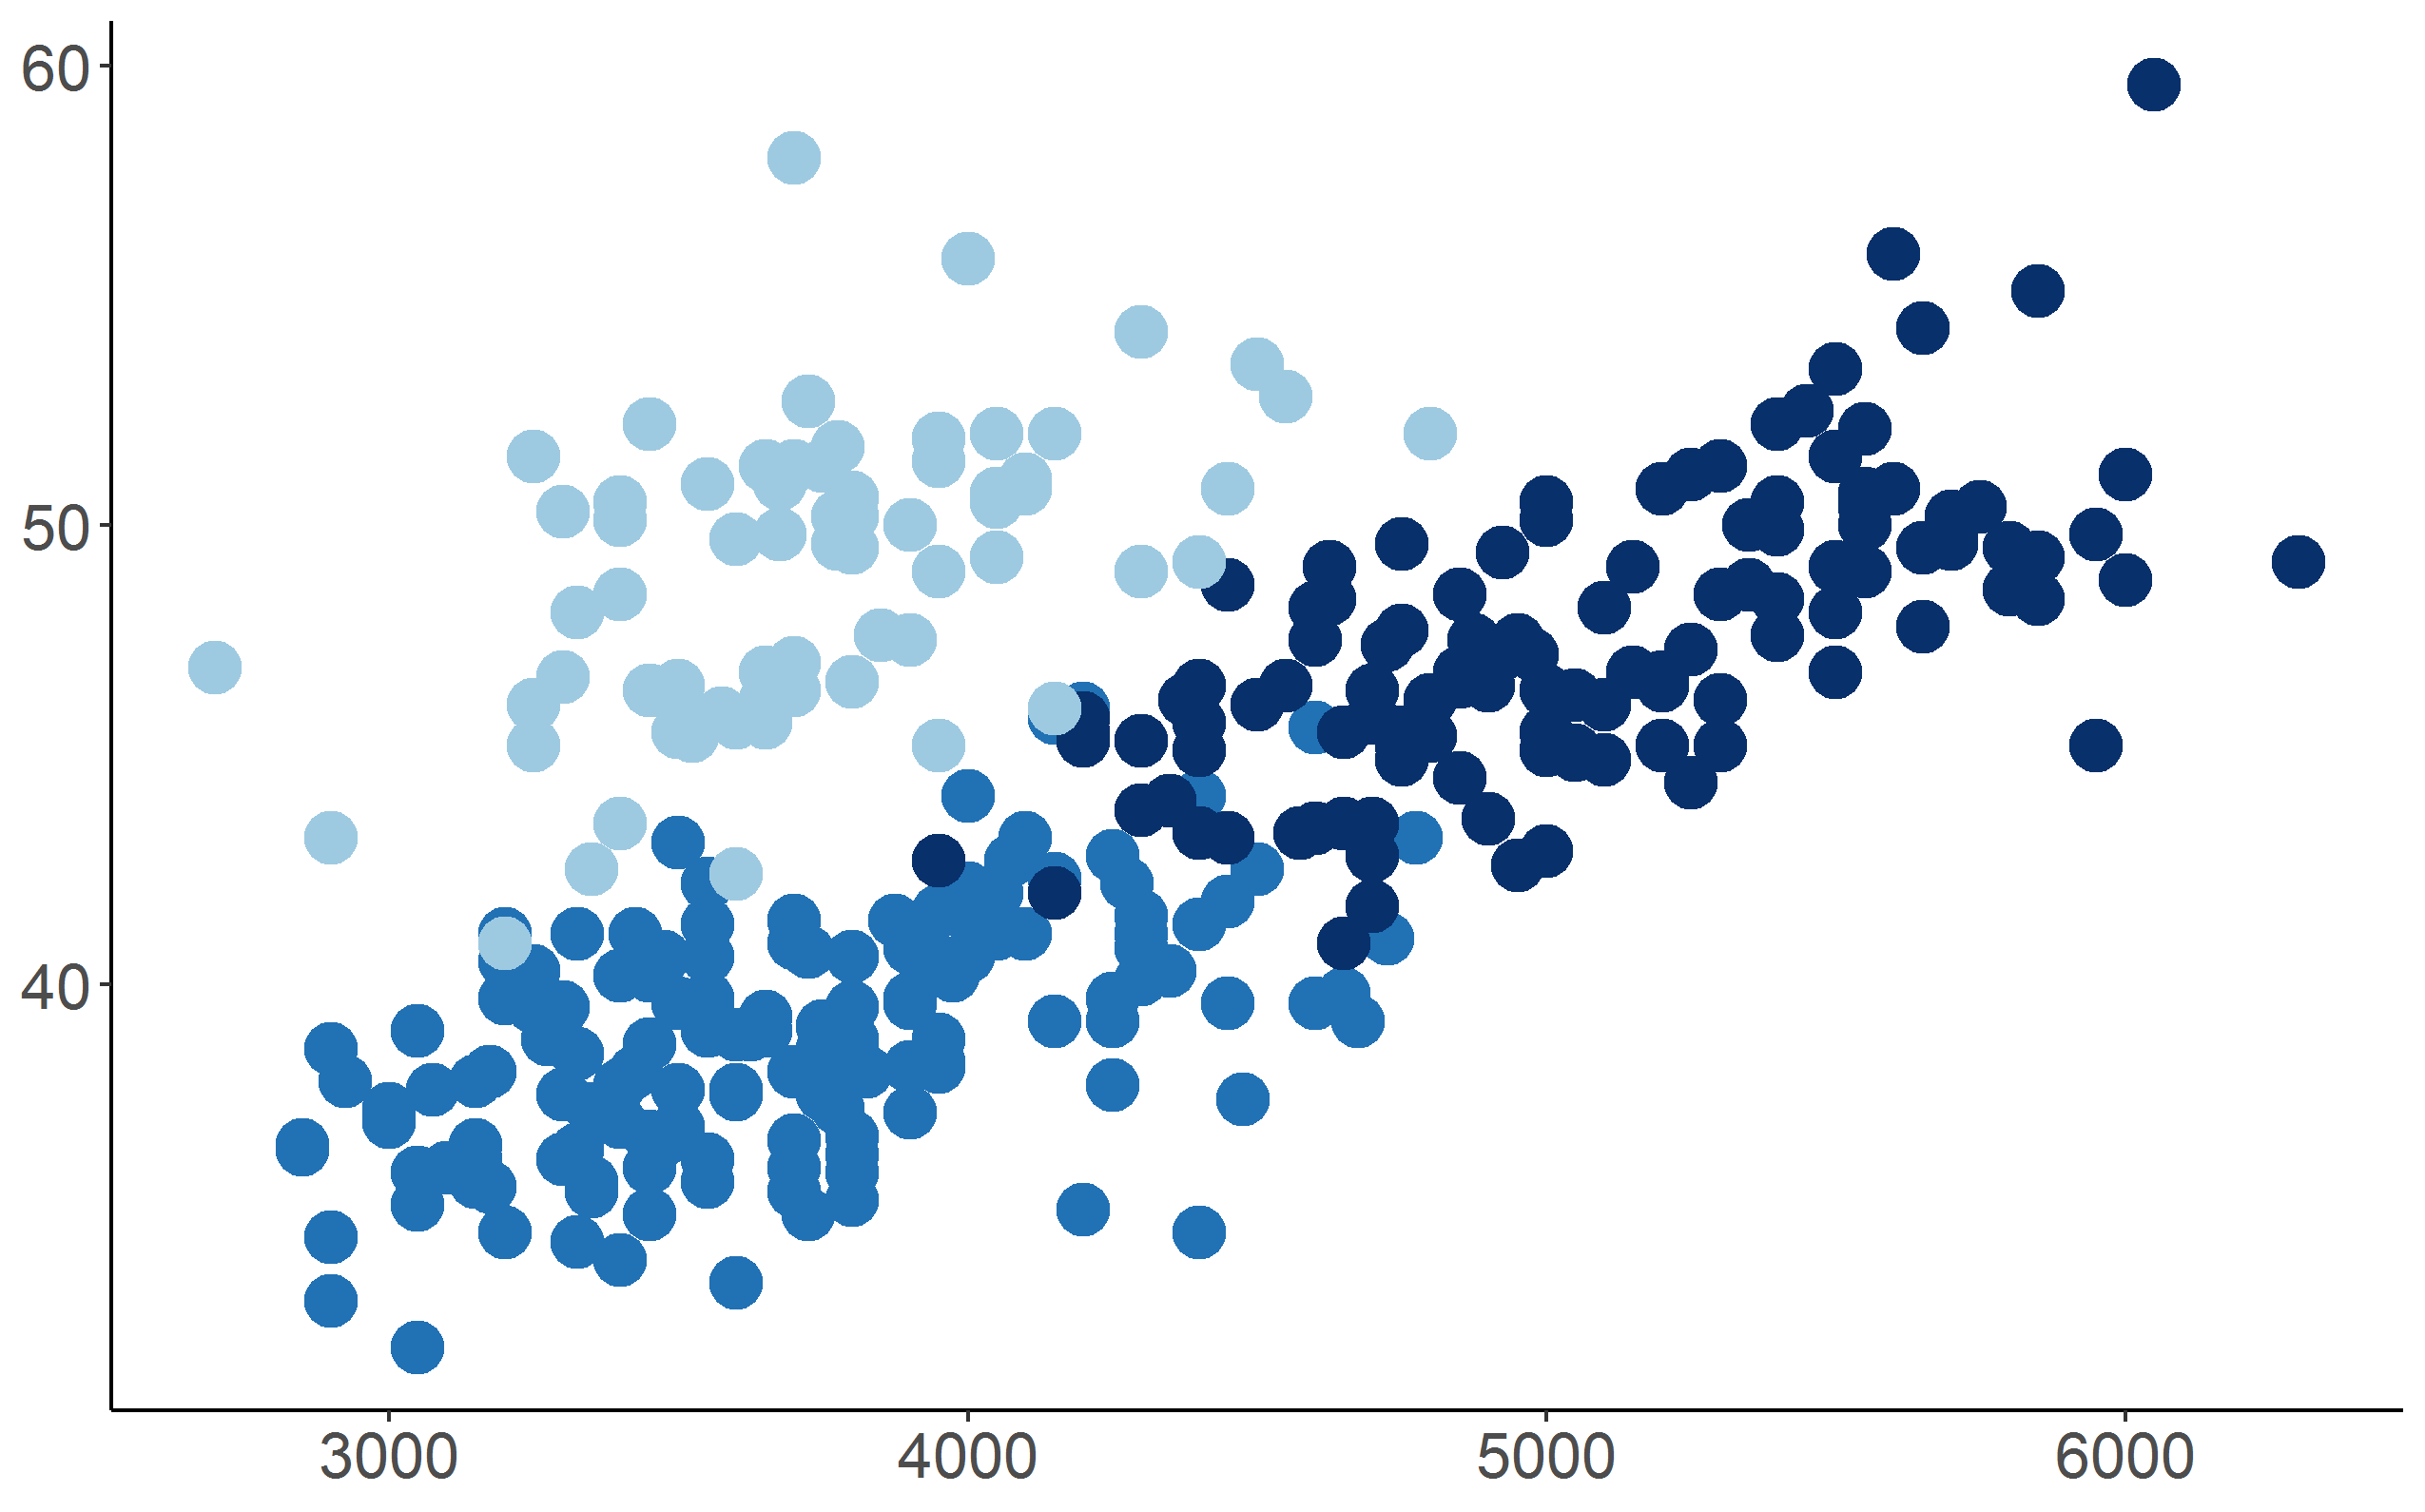
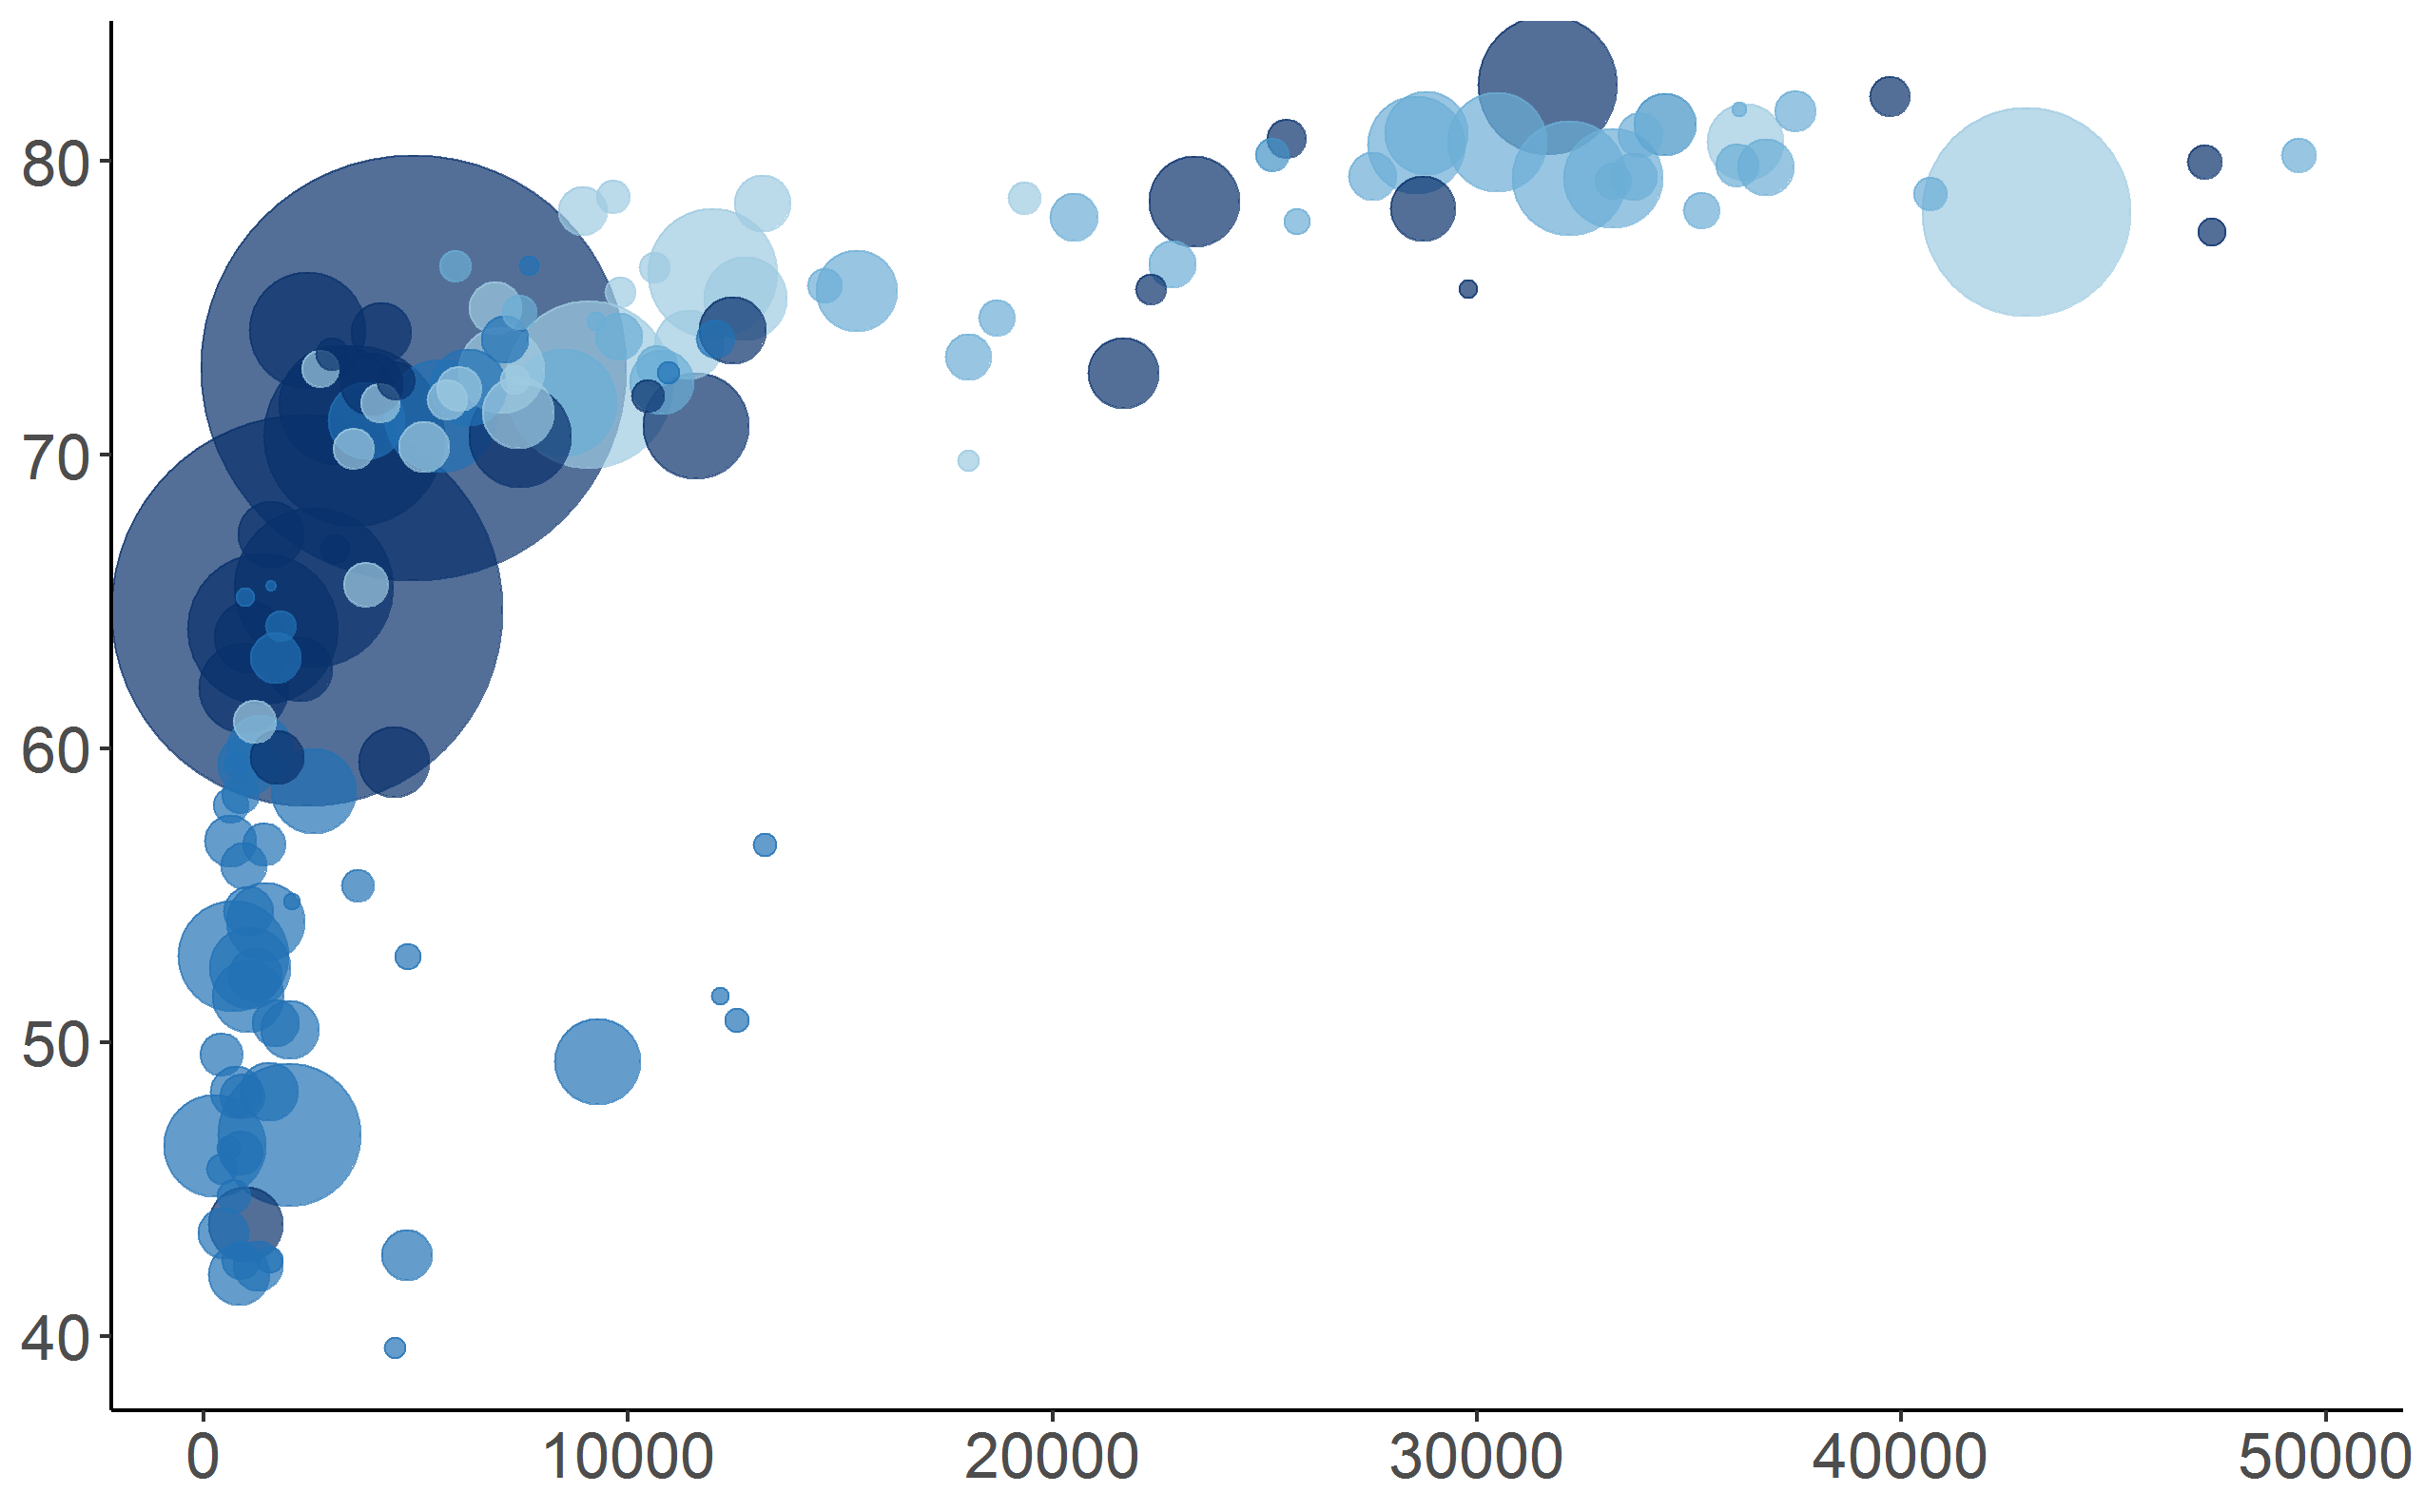
Bubble plot
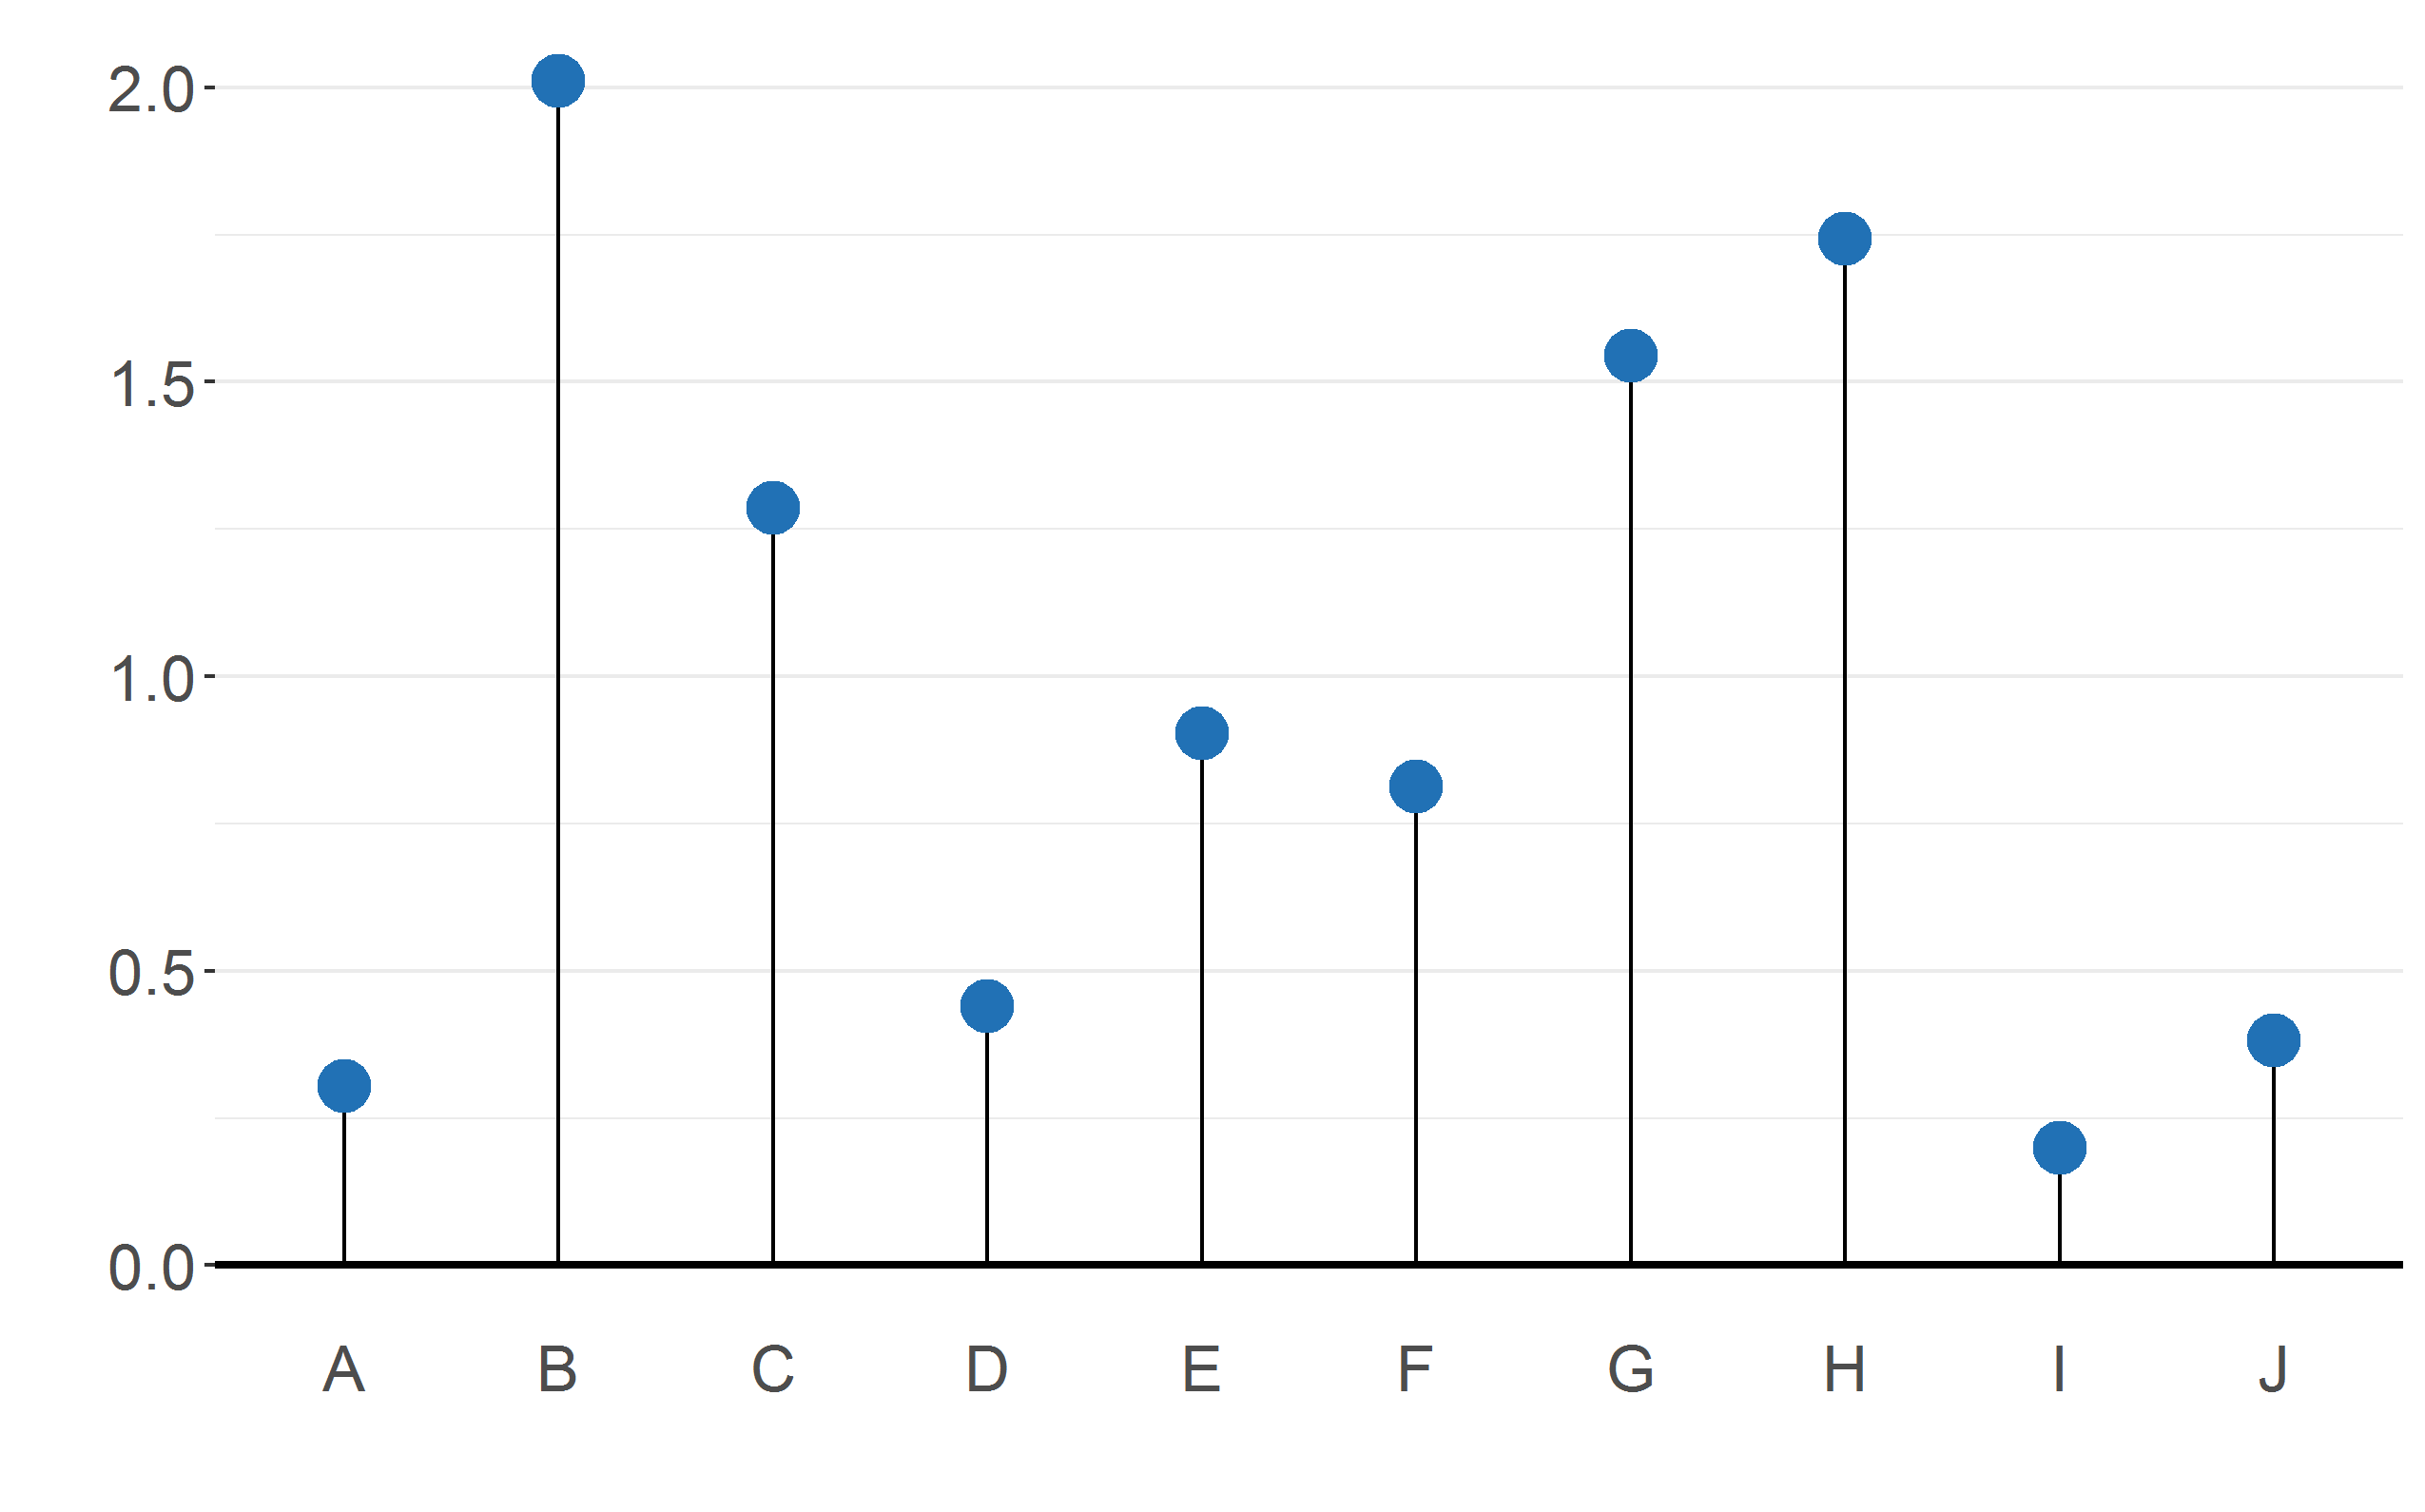
Lollipop plot
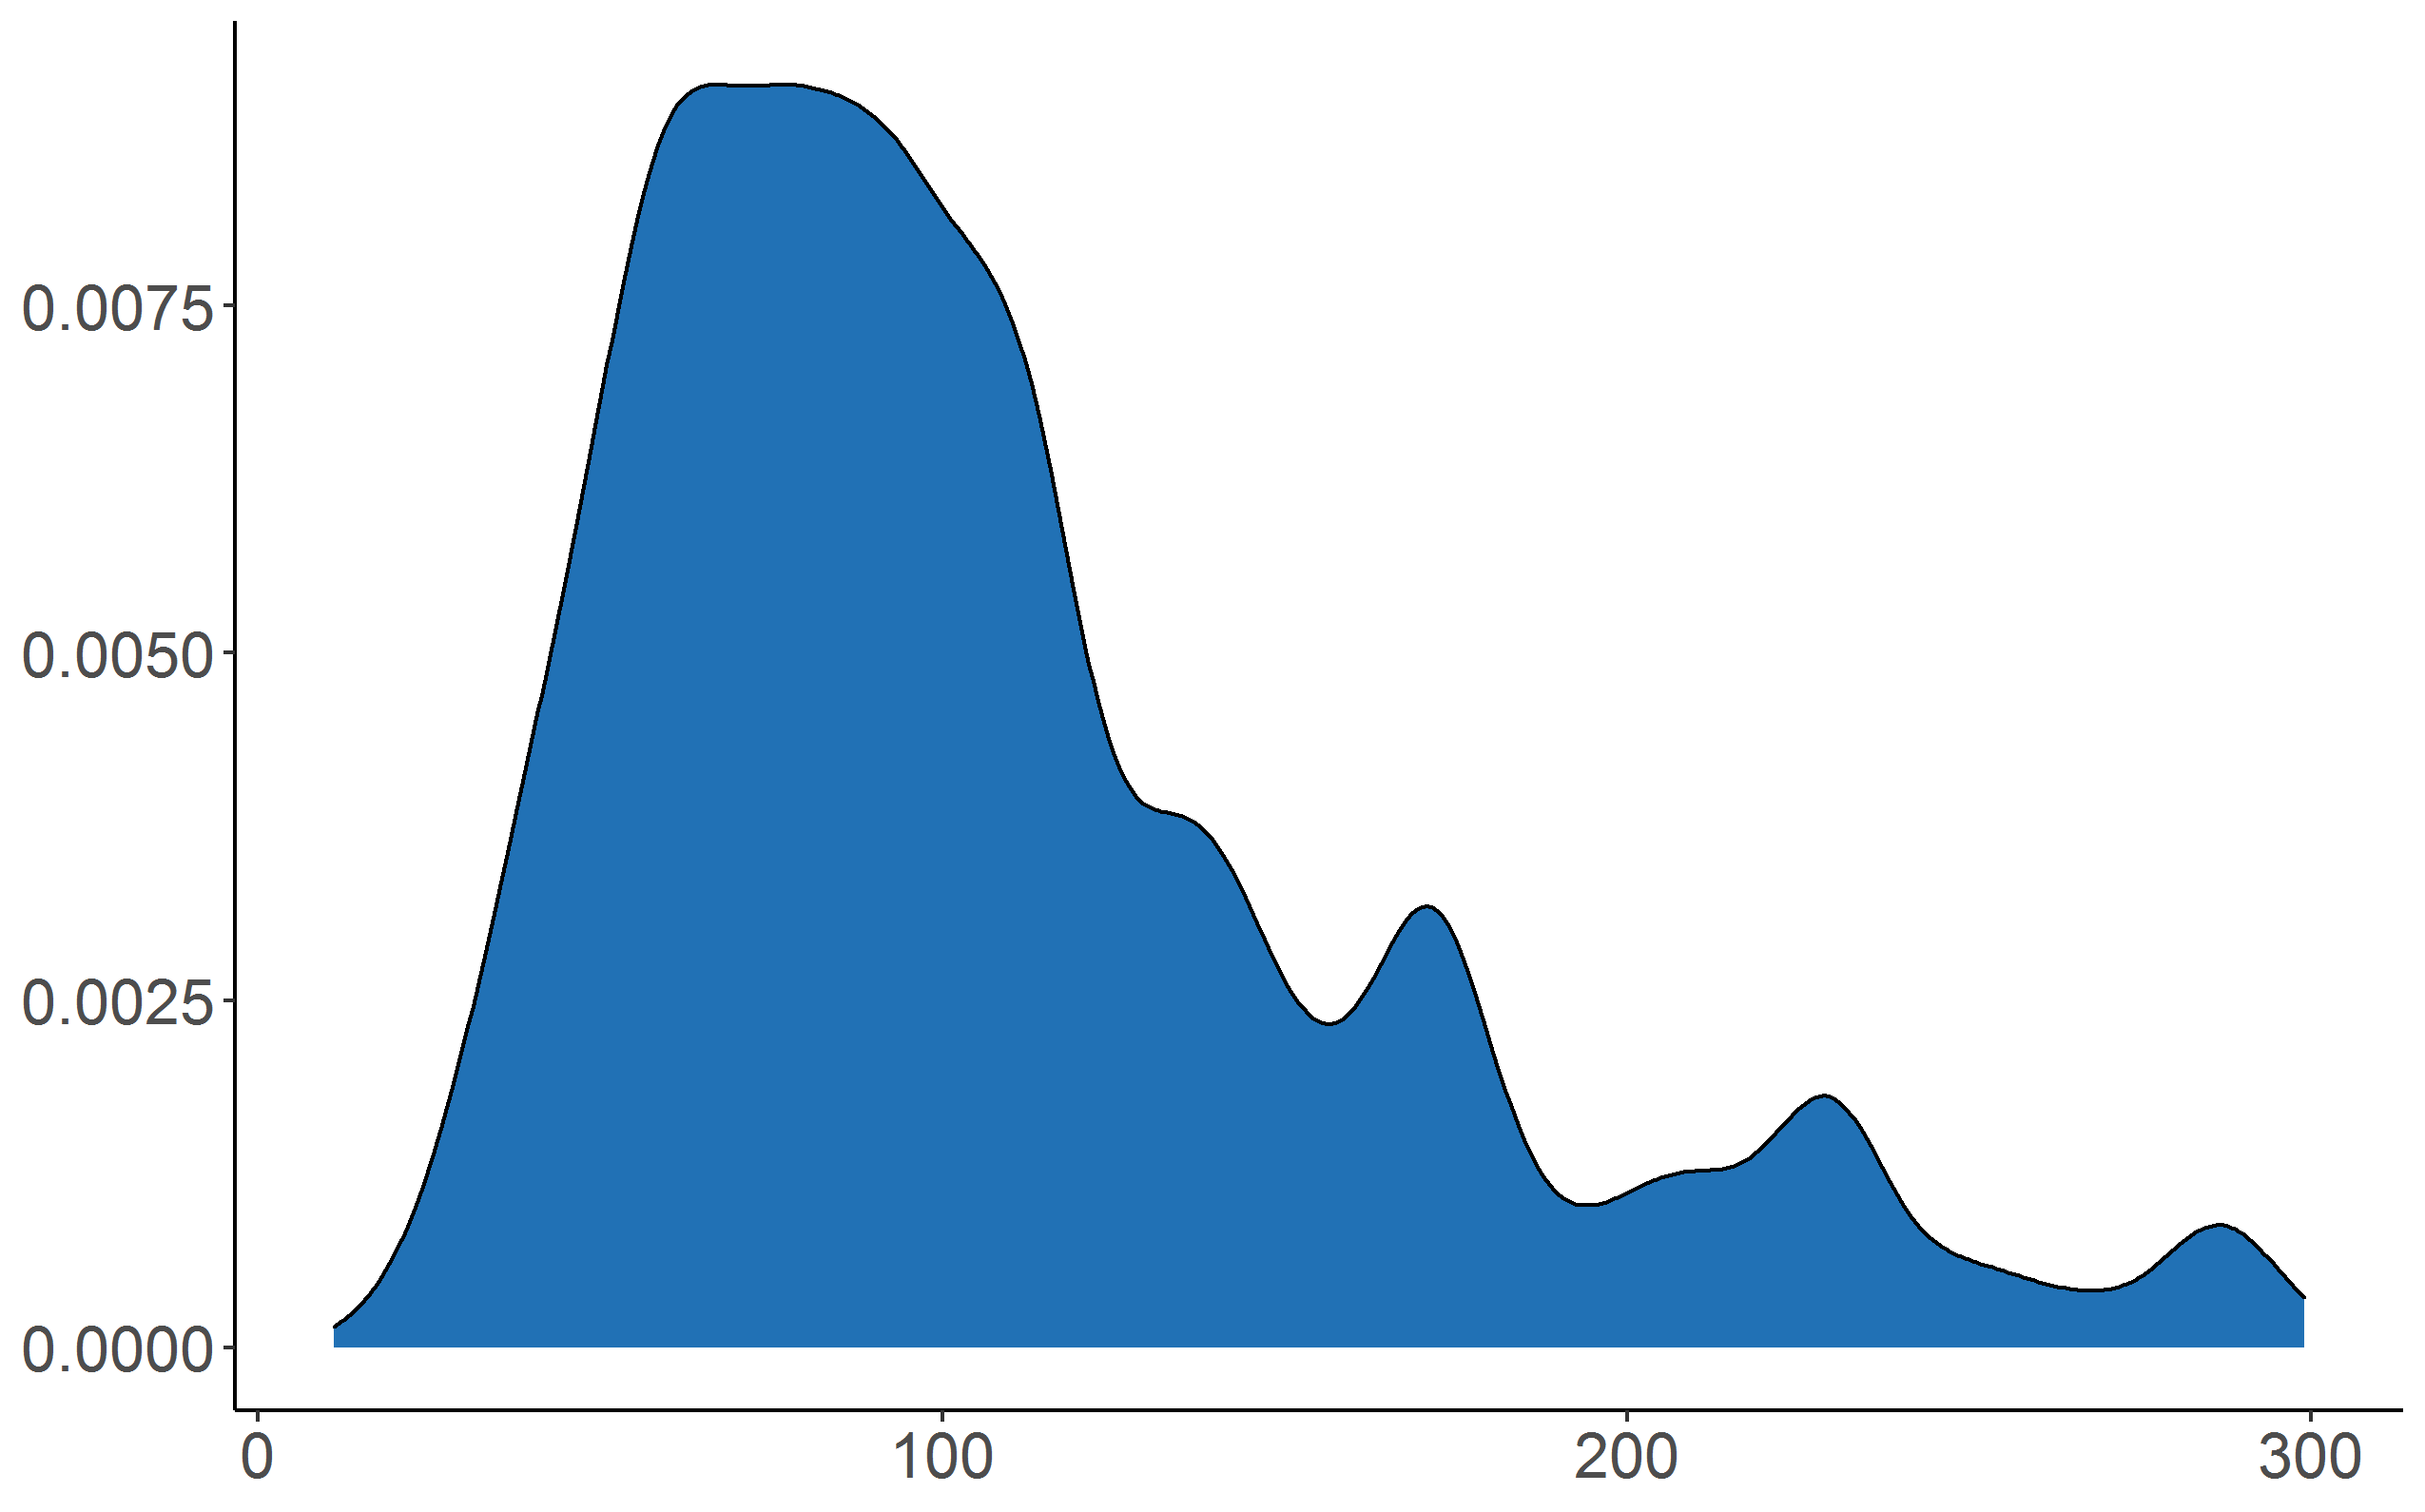
Density plot
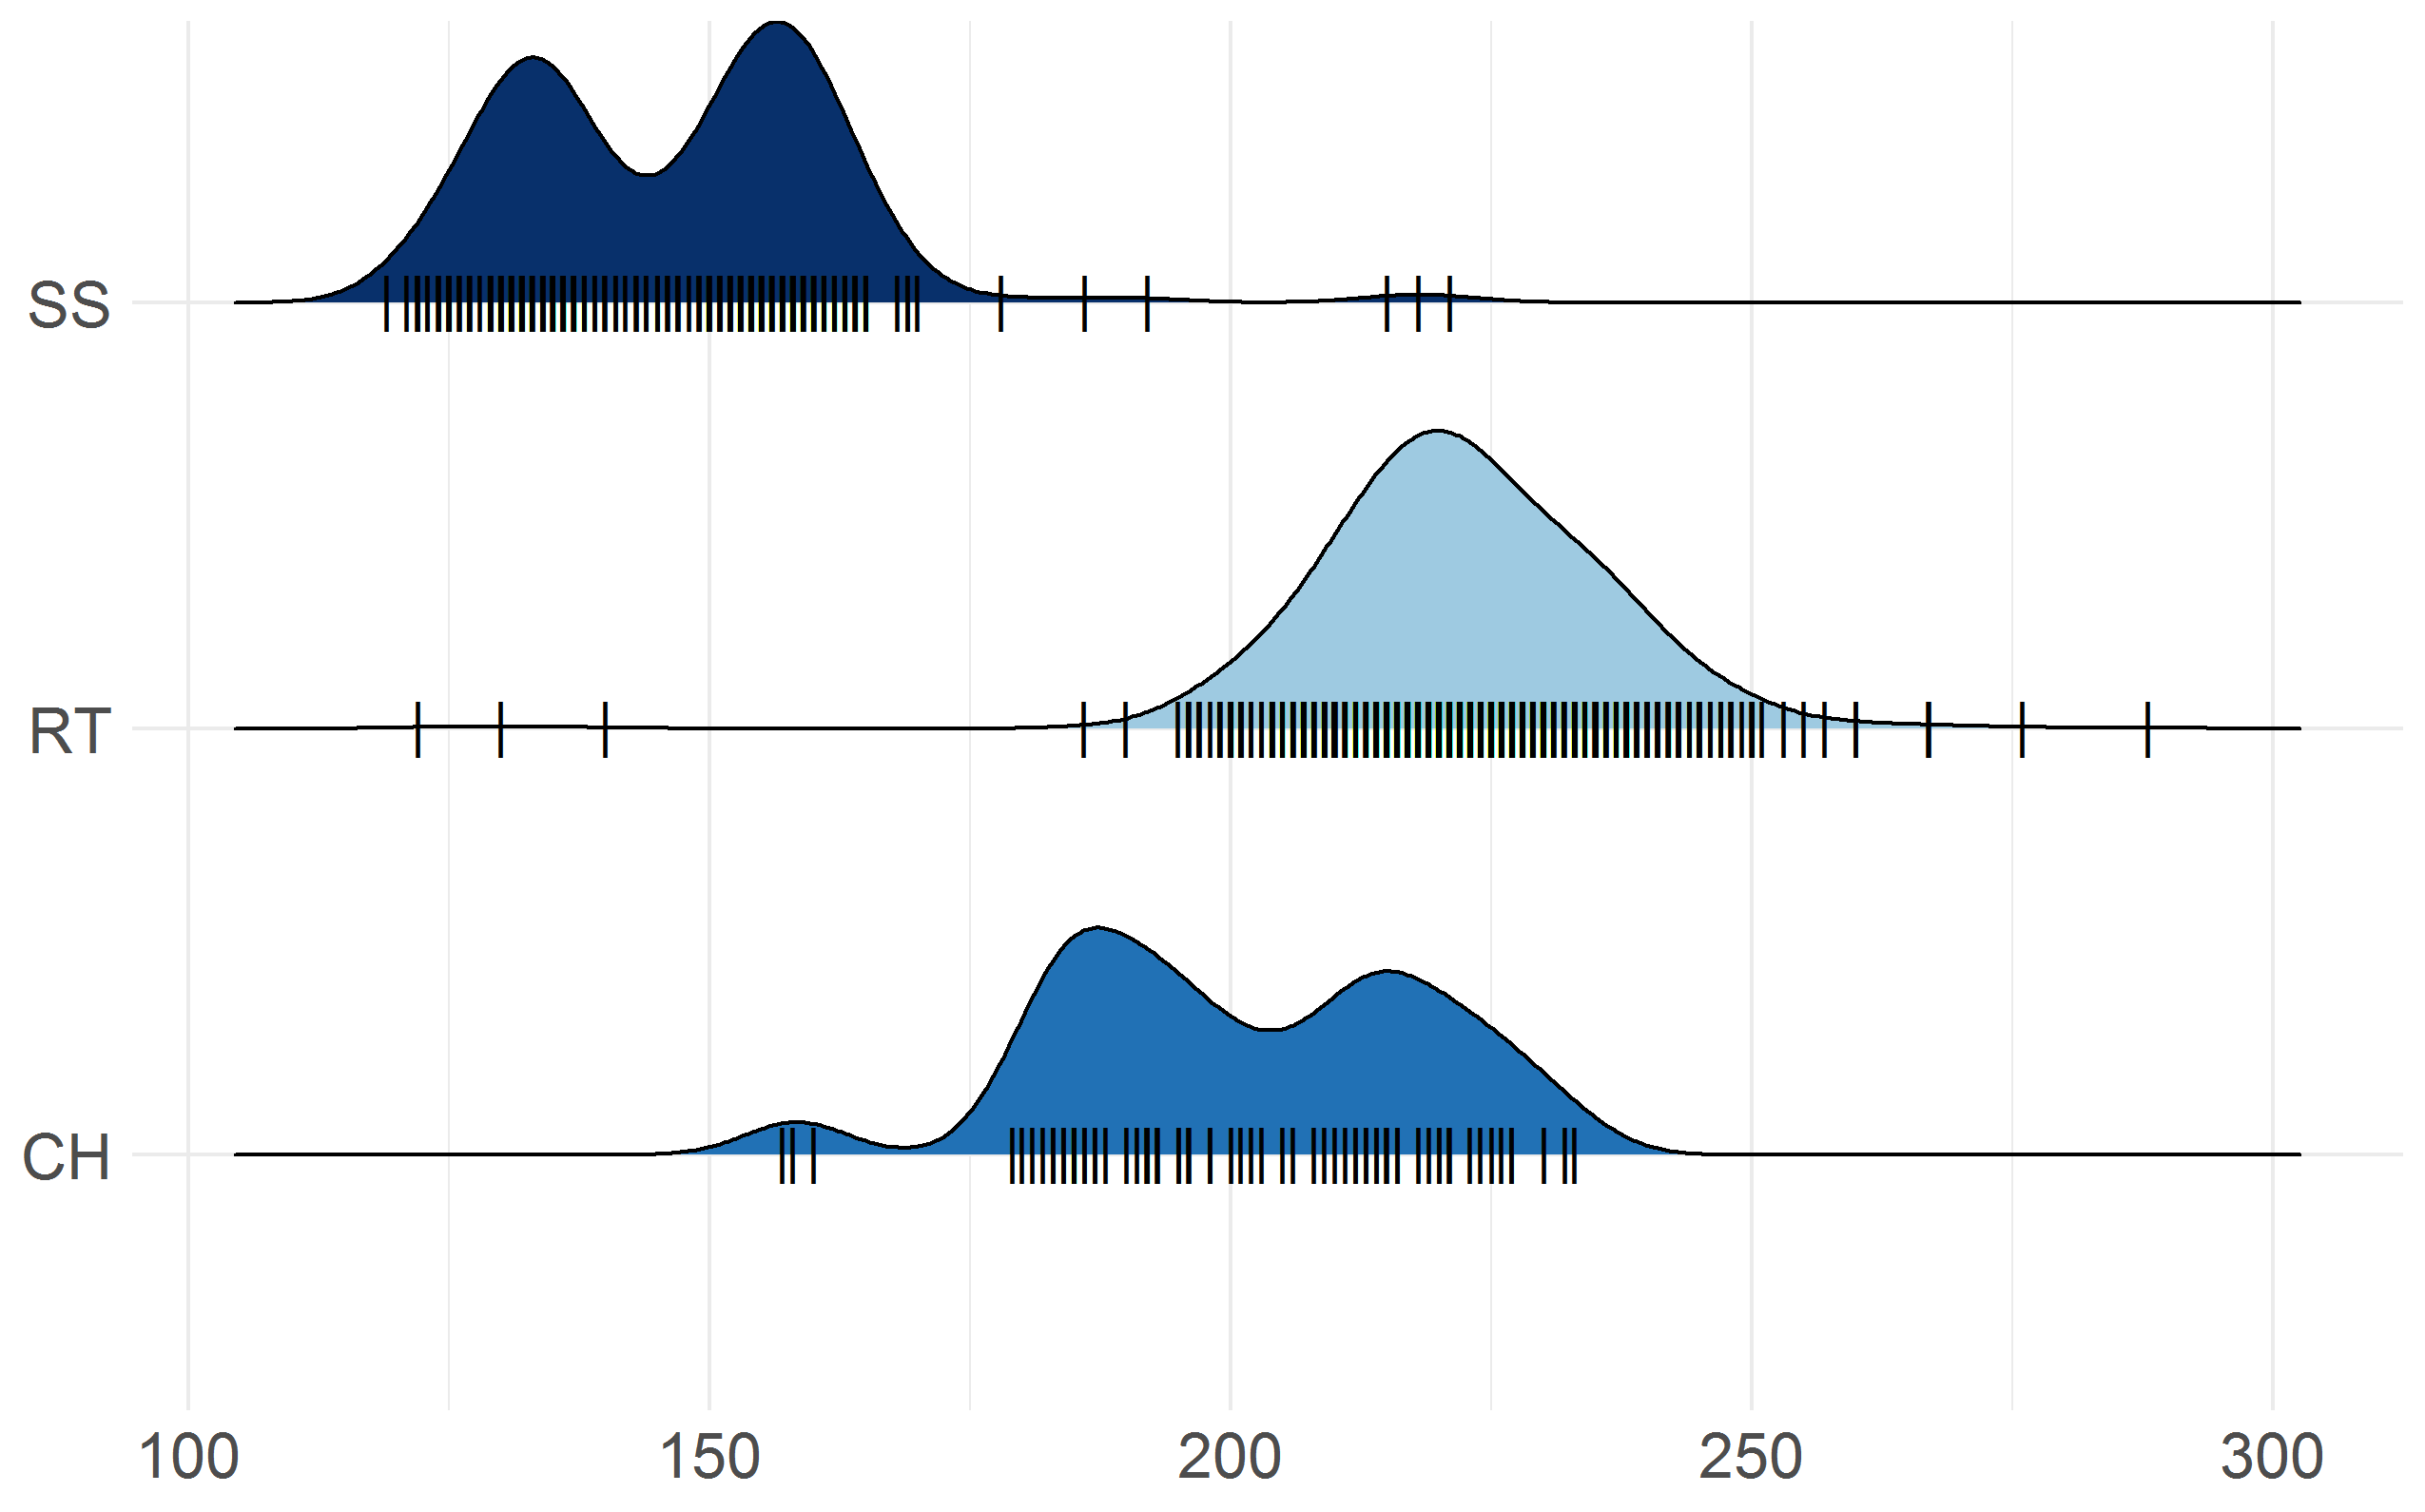
Distribution plots
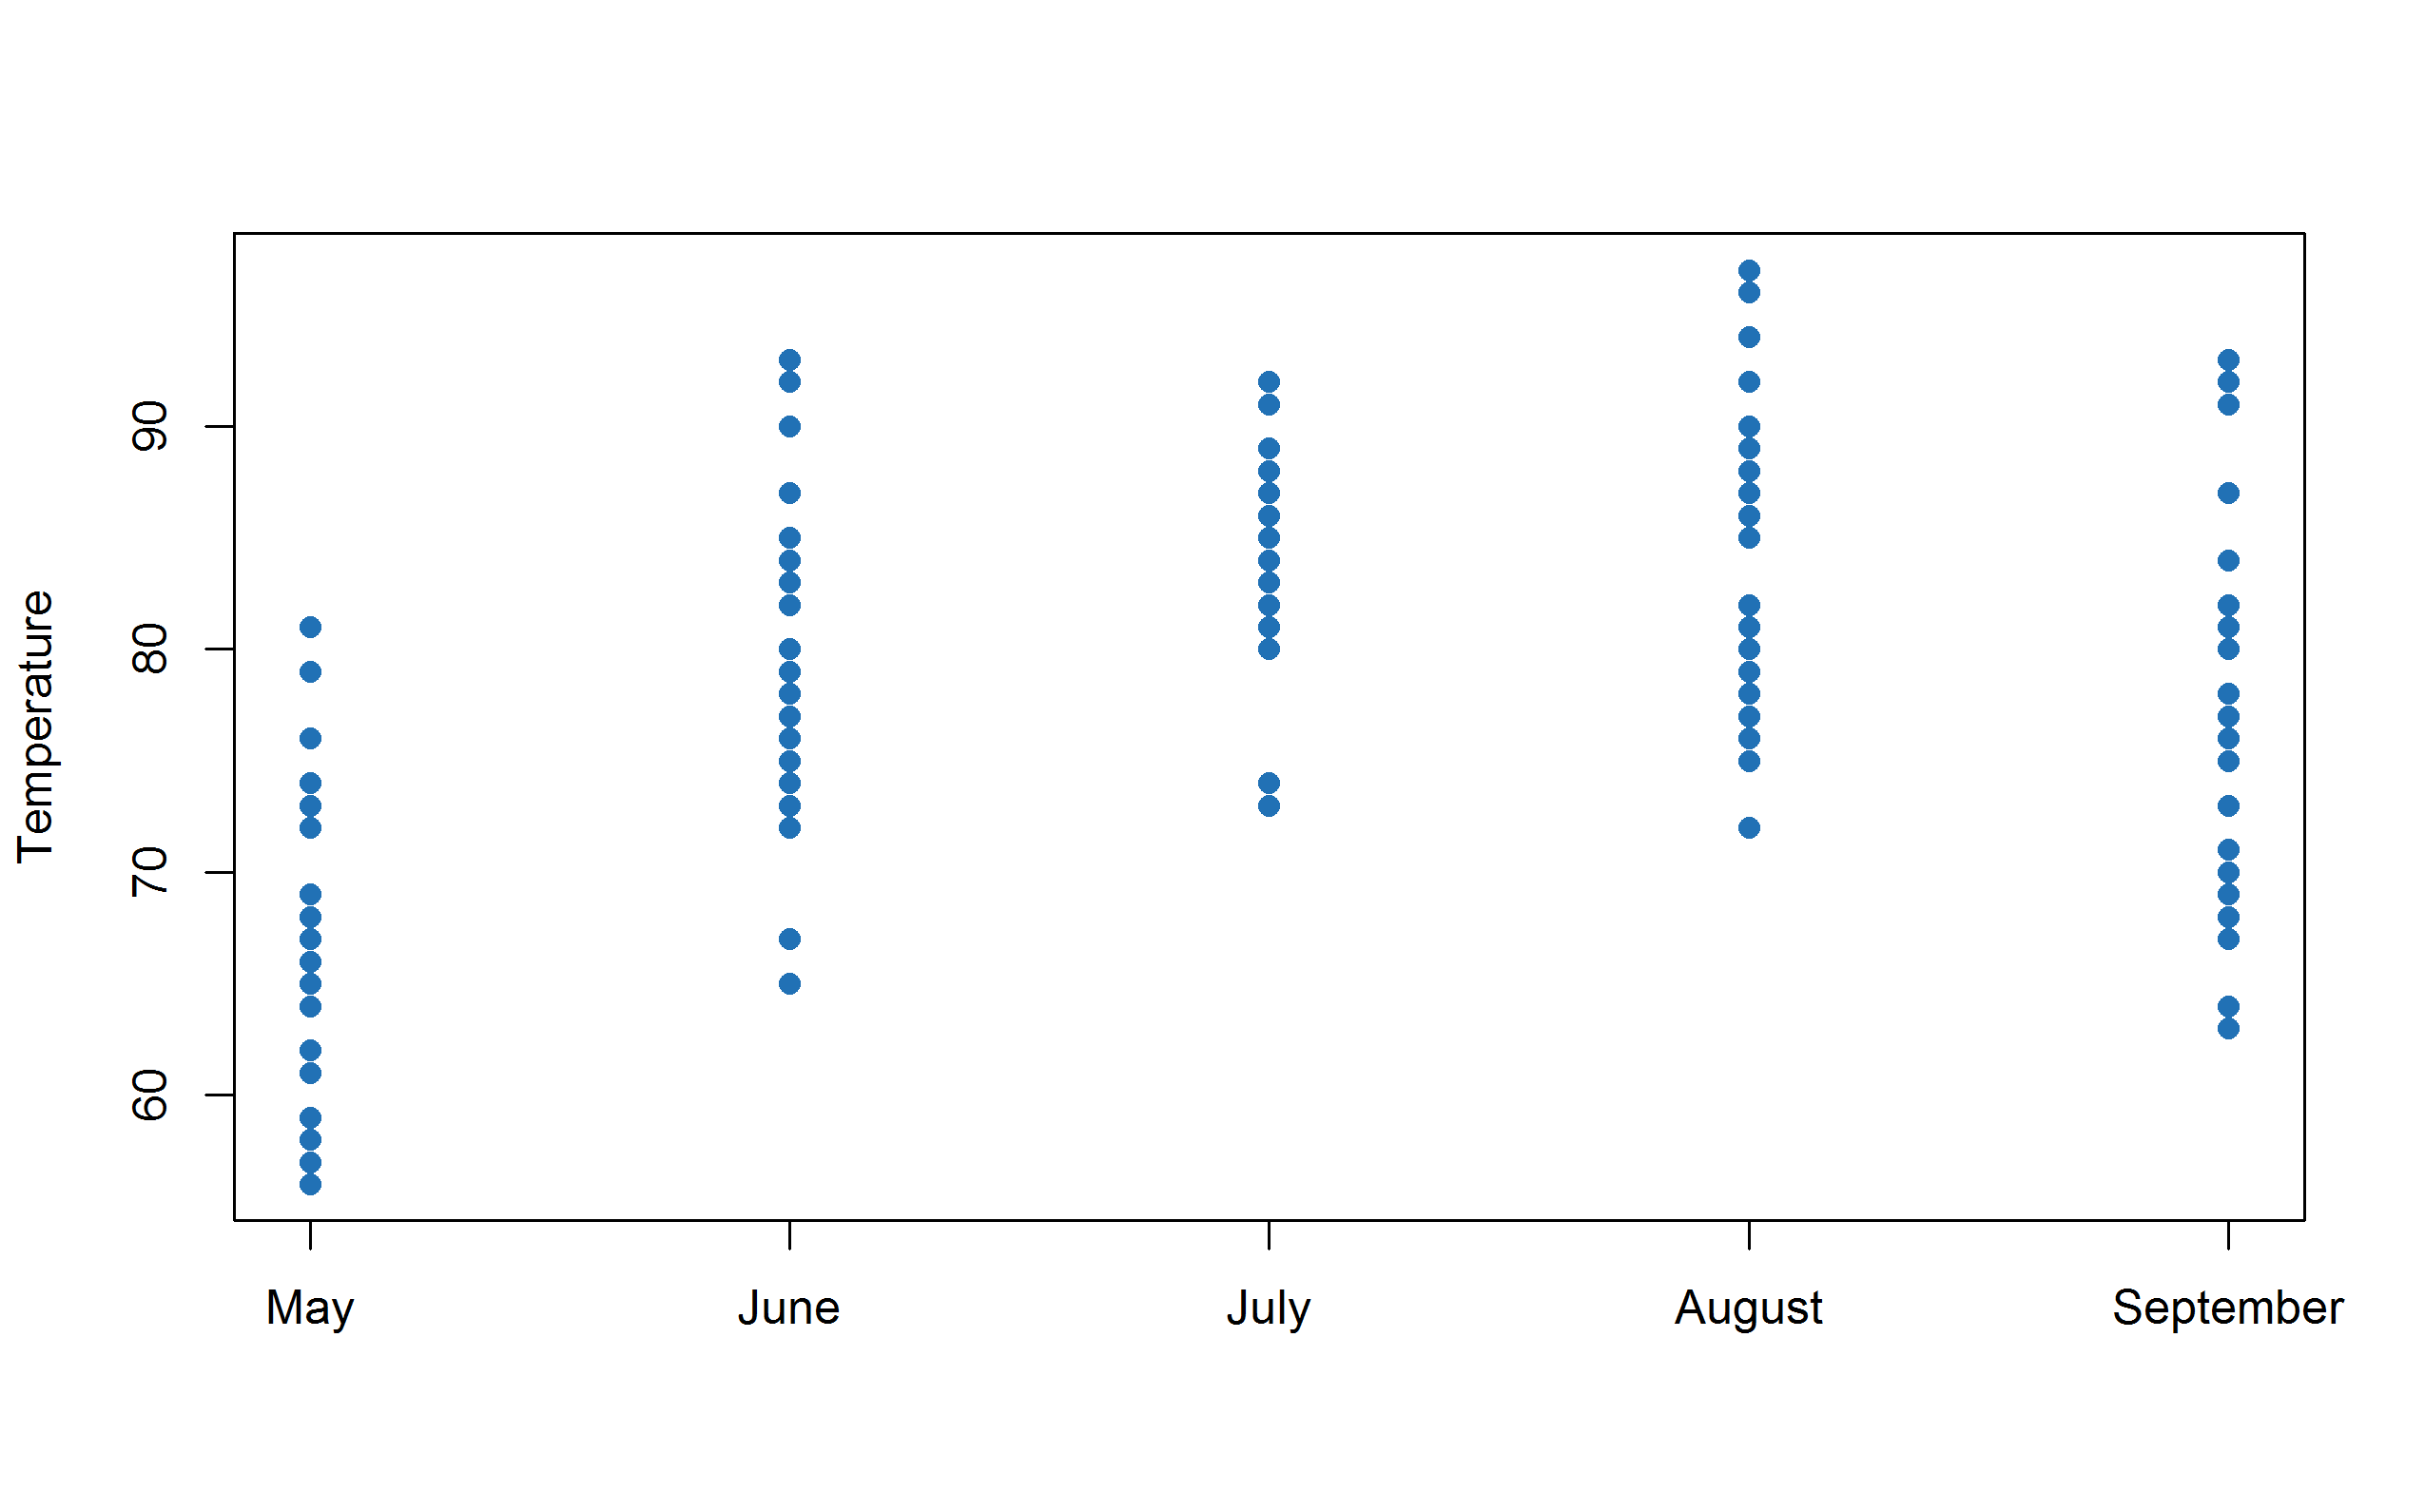
Strip chart
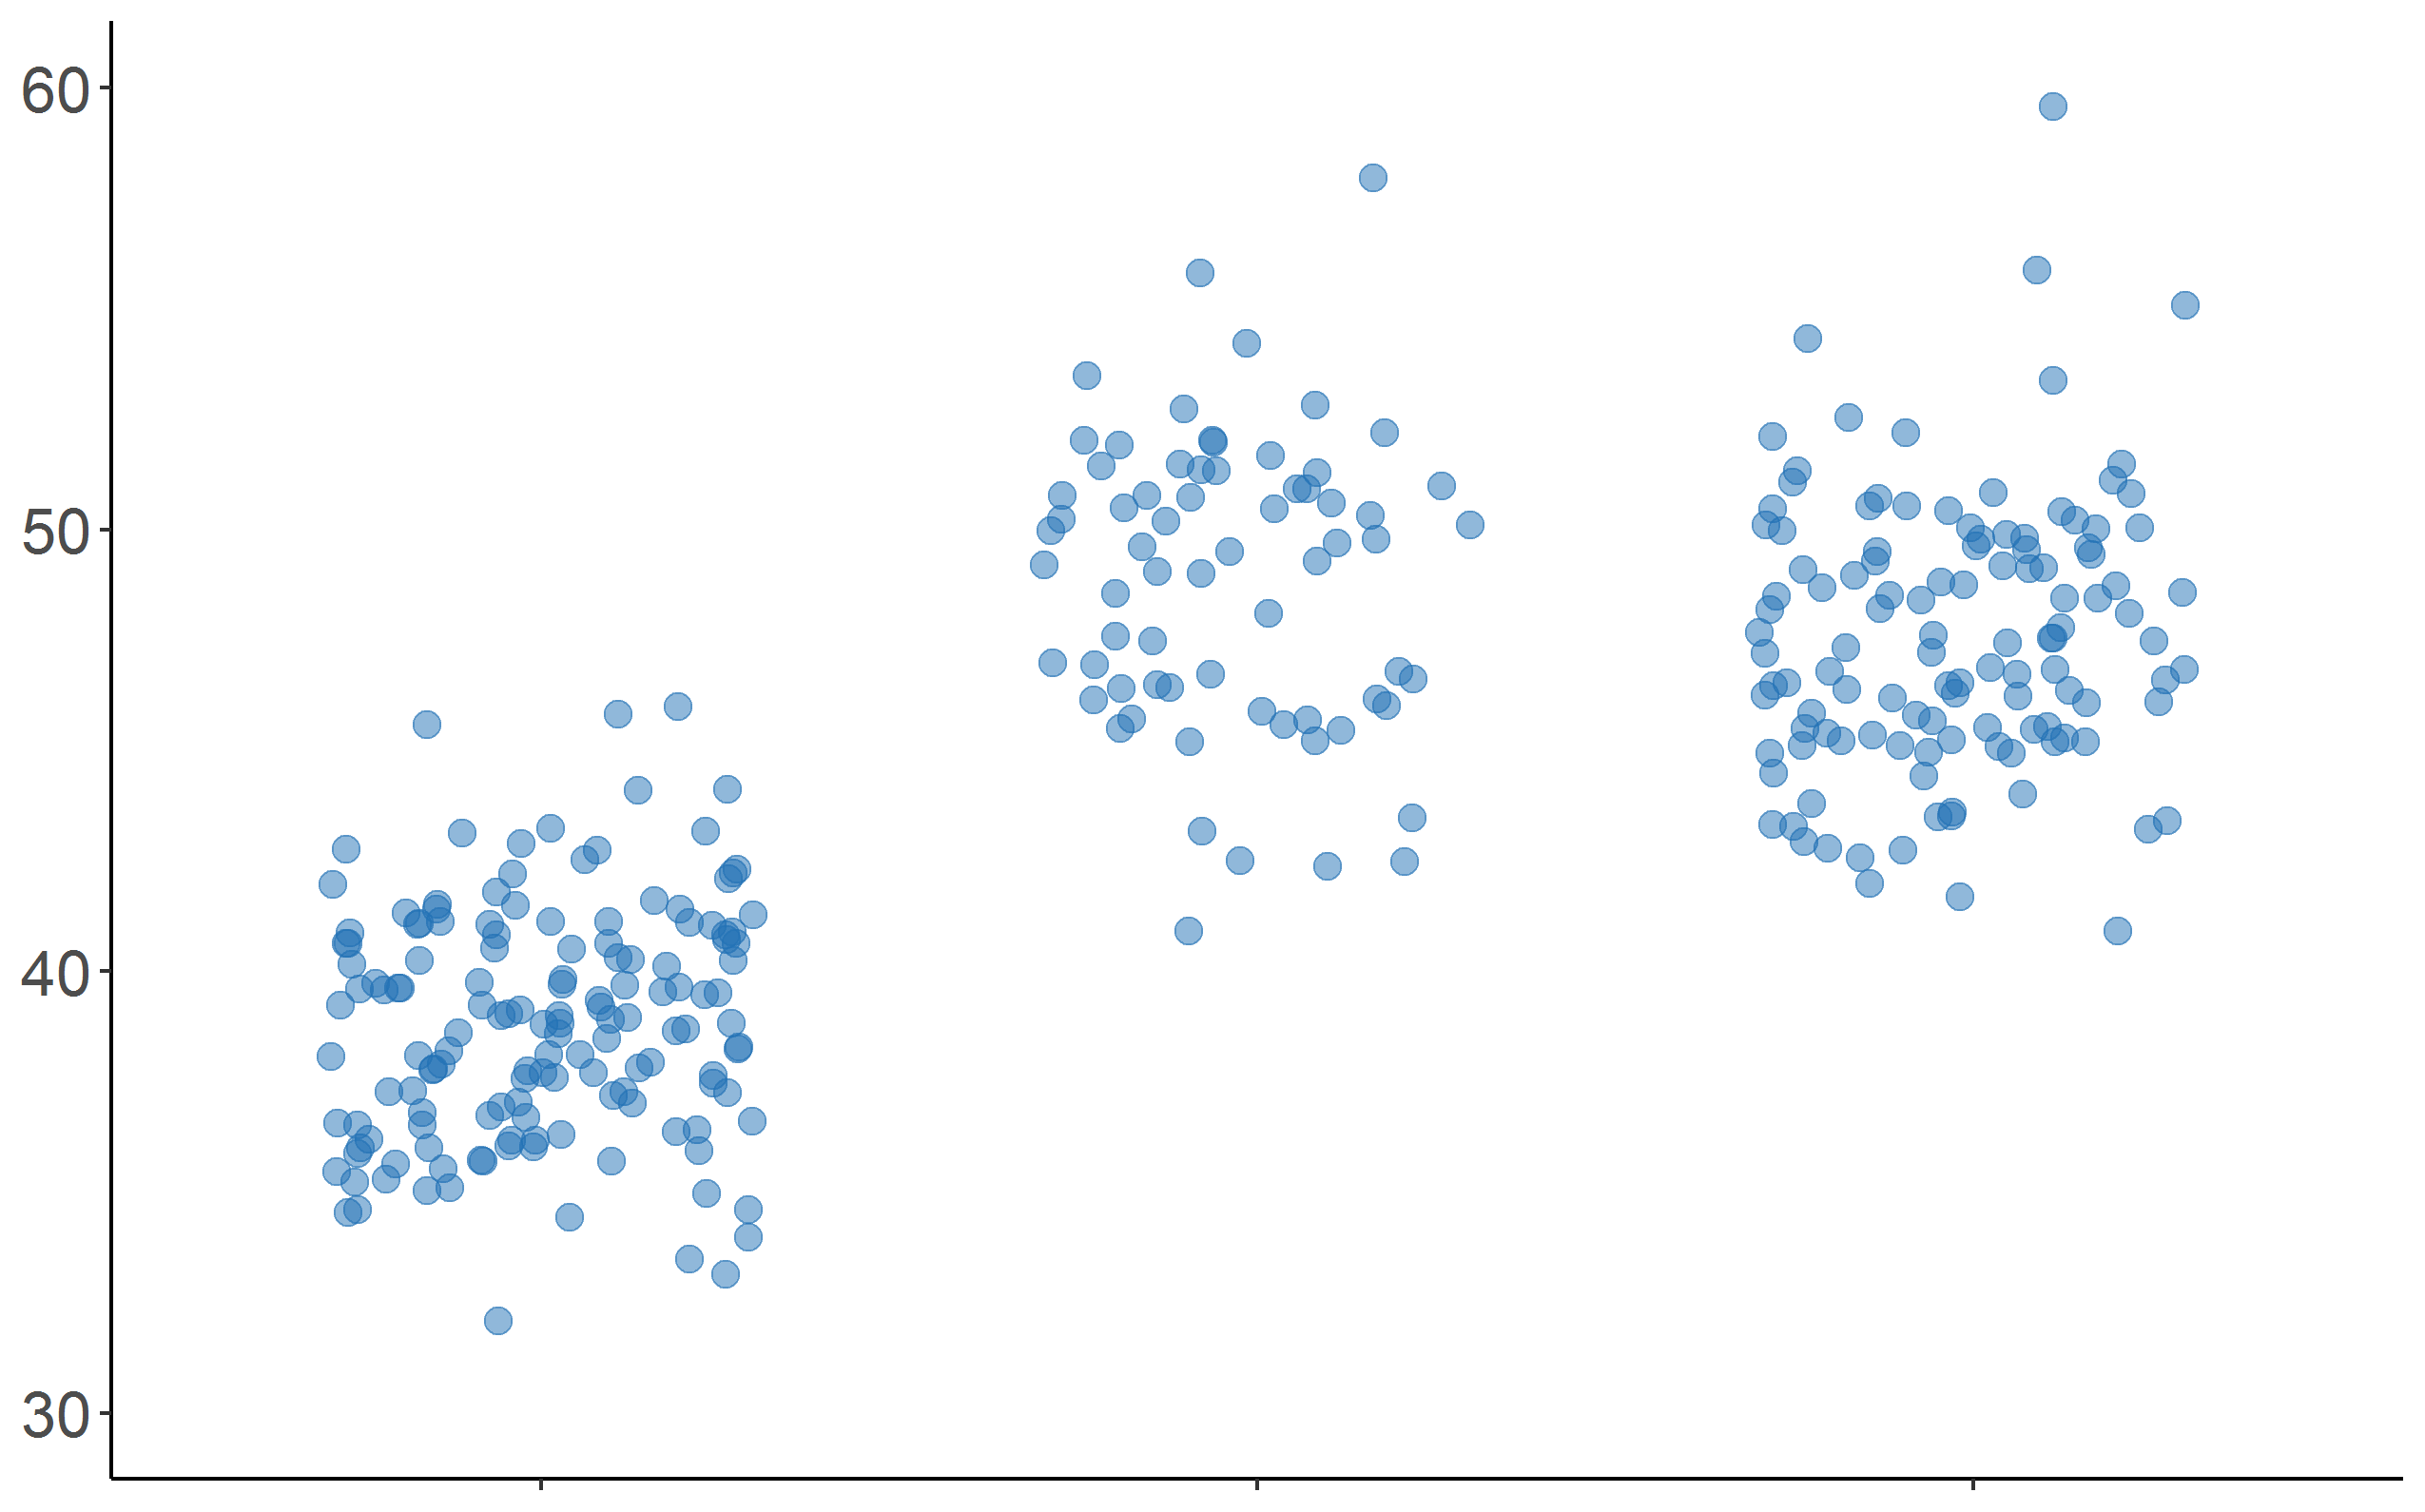
Jitter plot
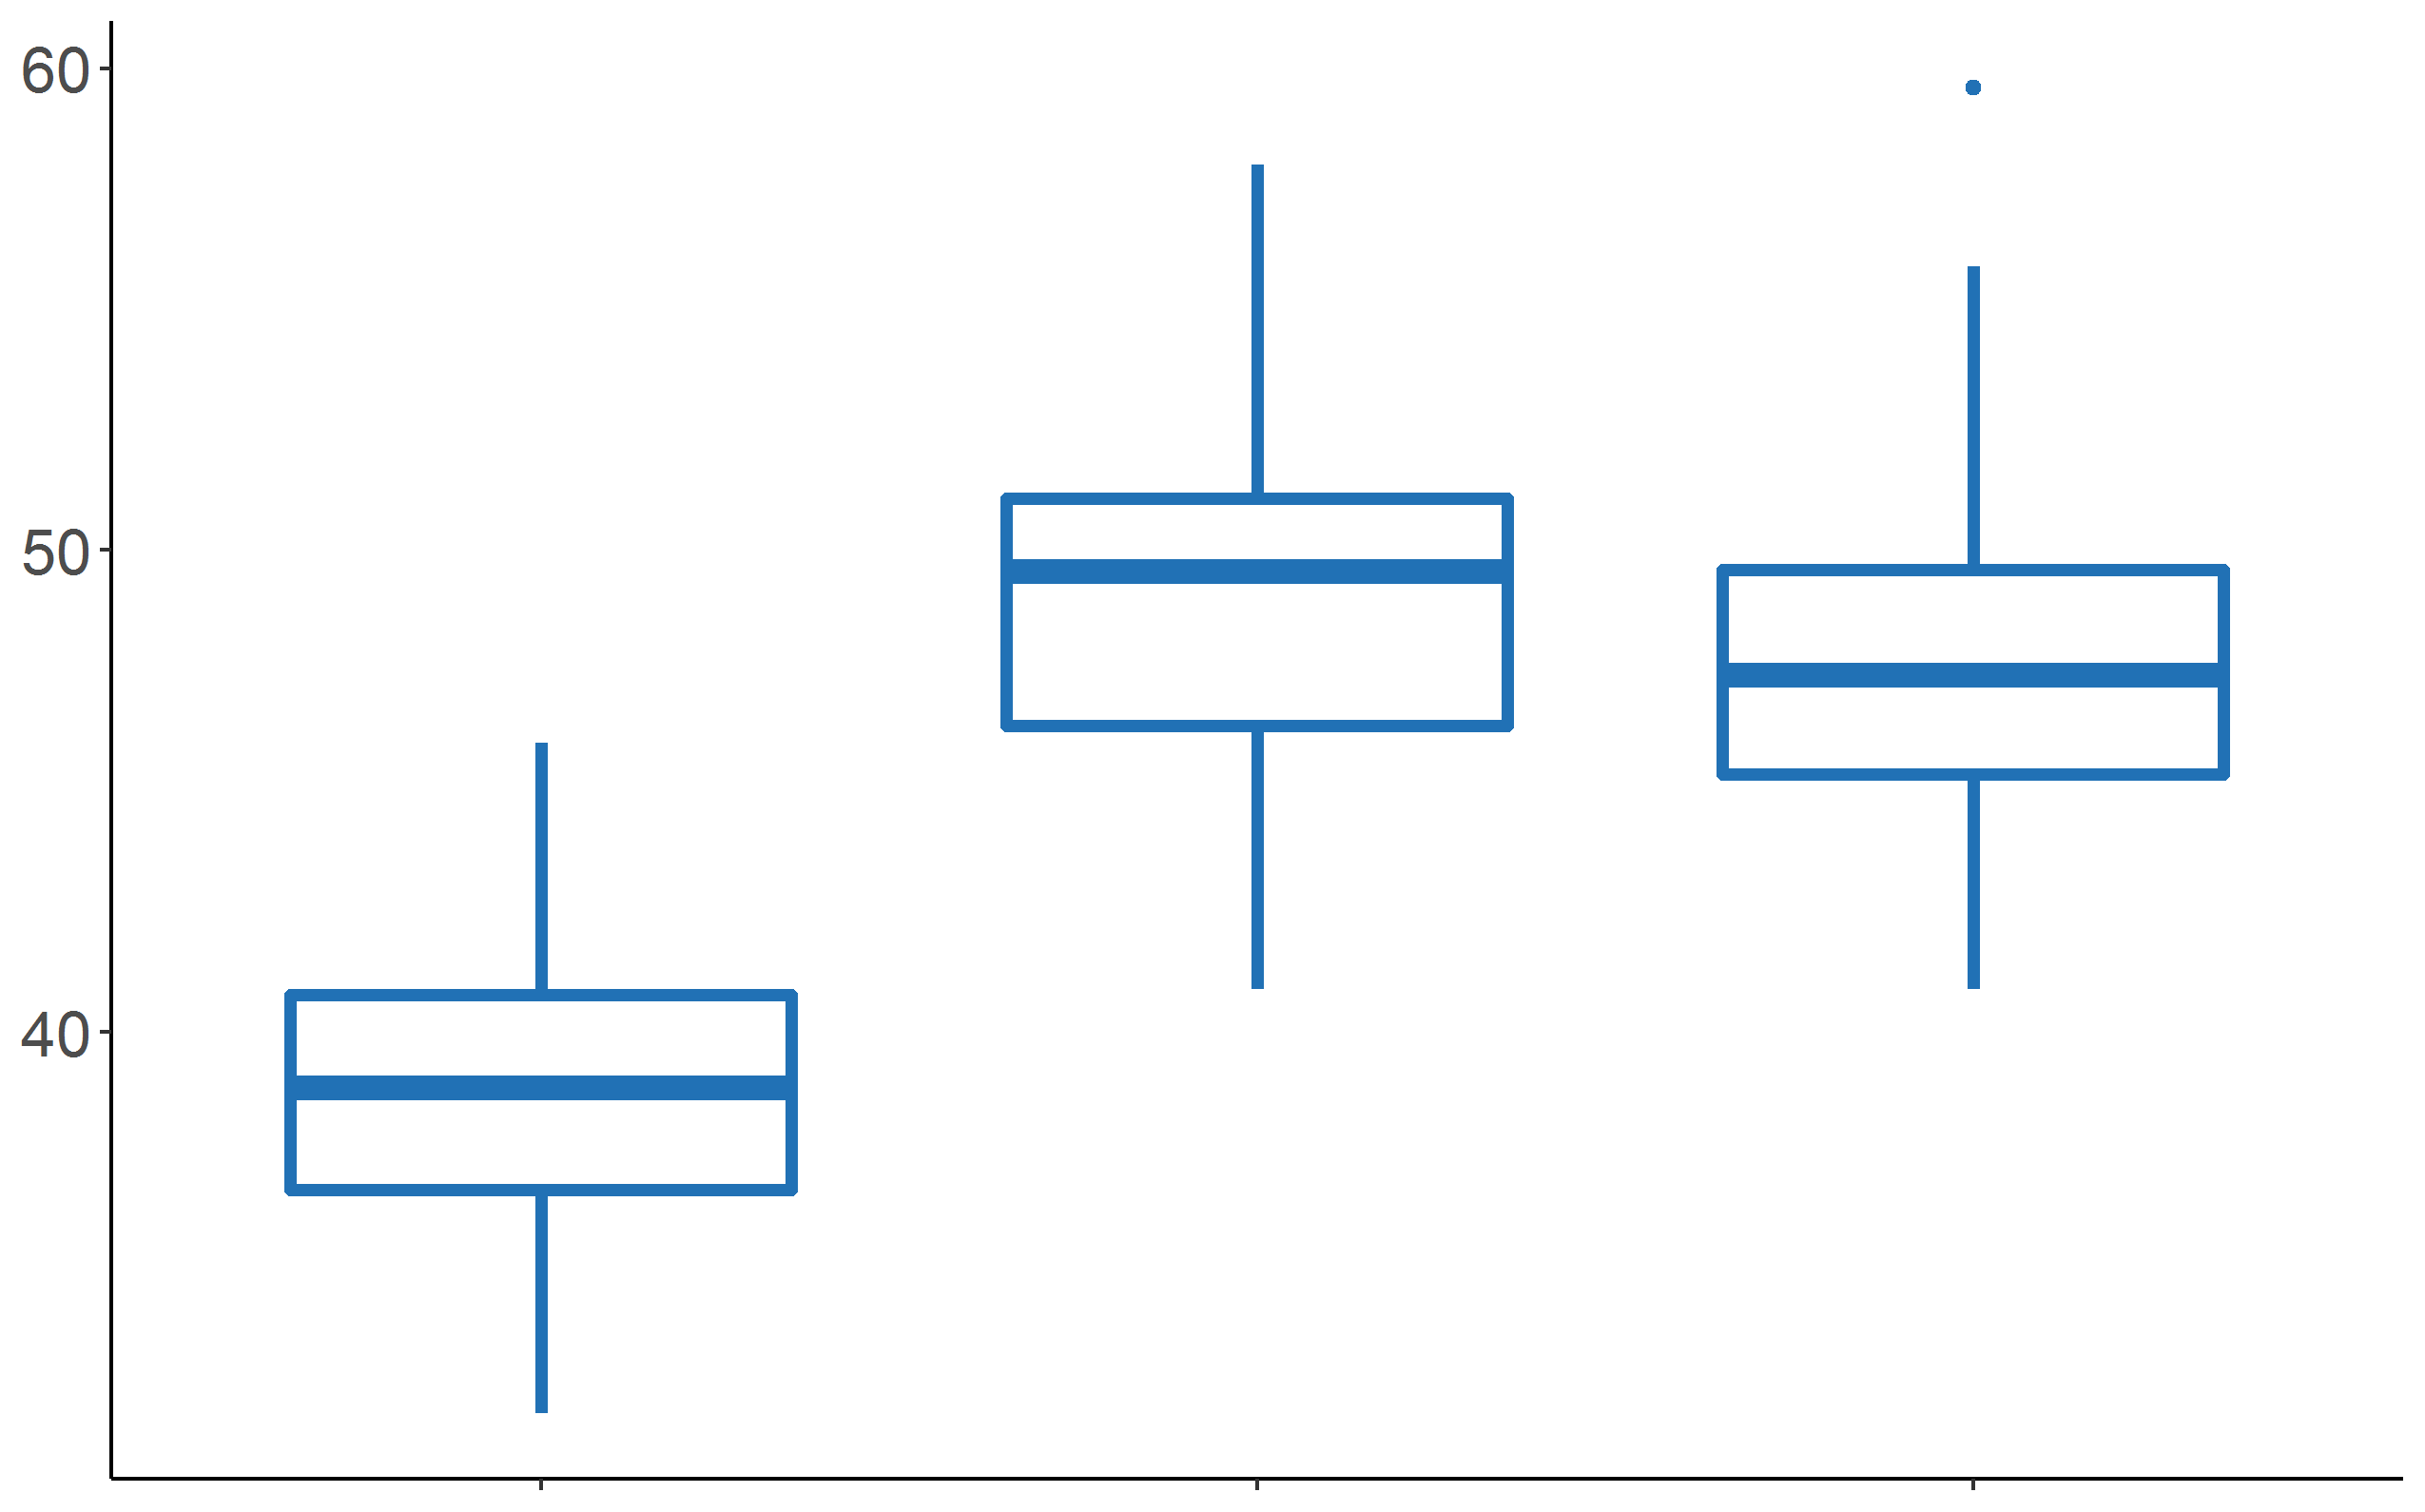
Boxplot
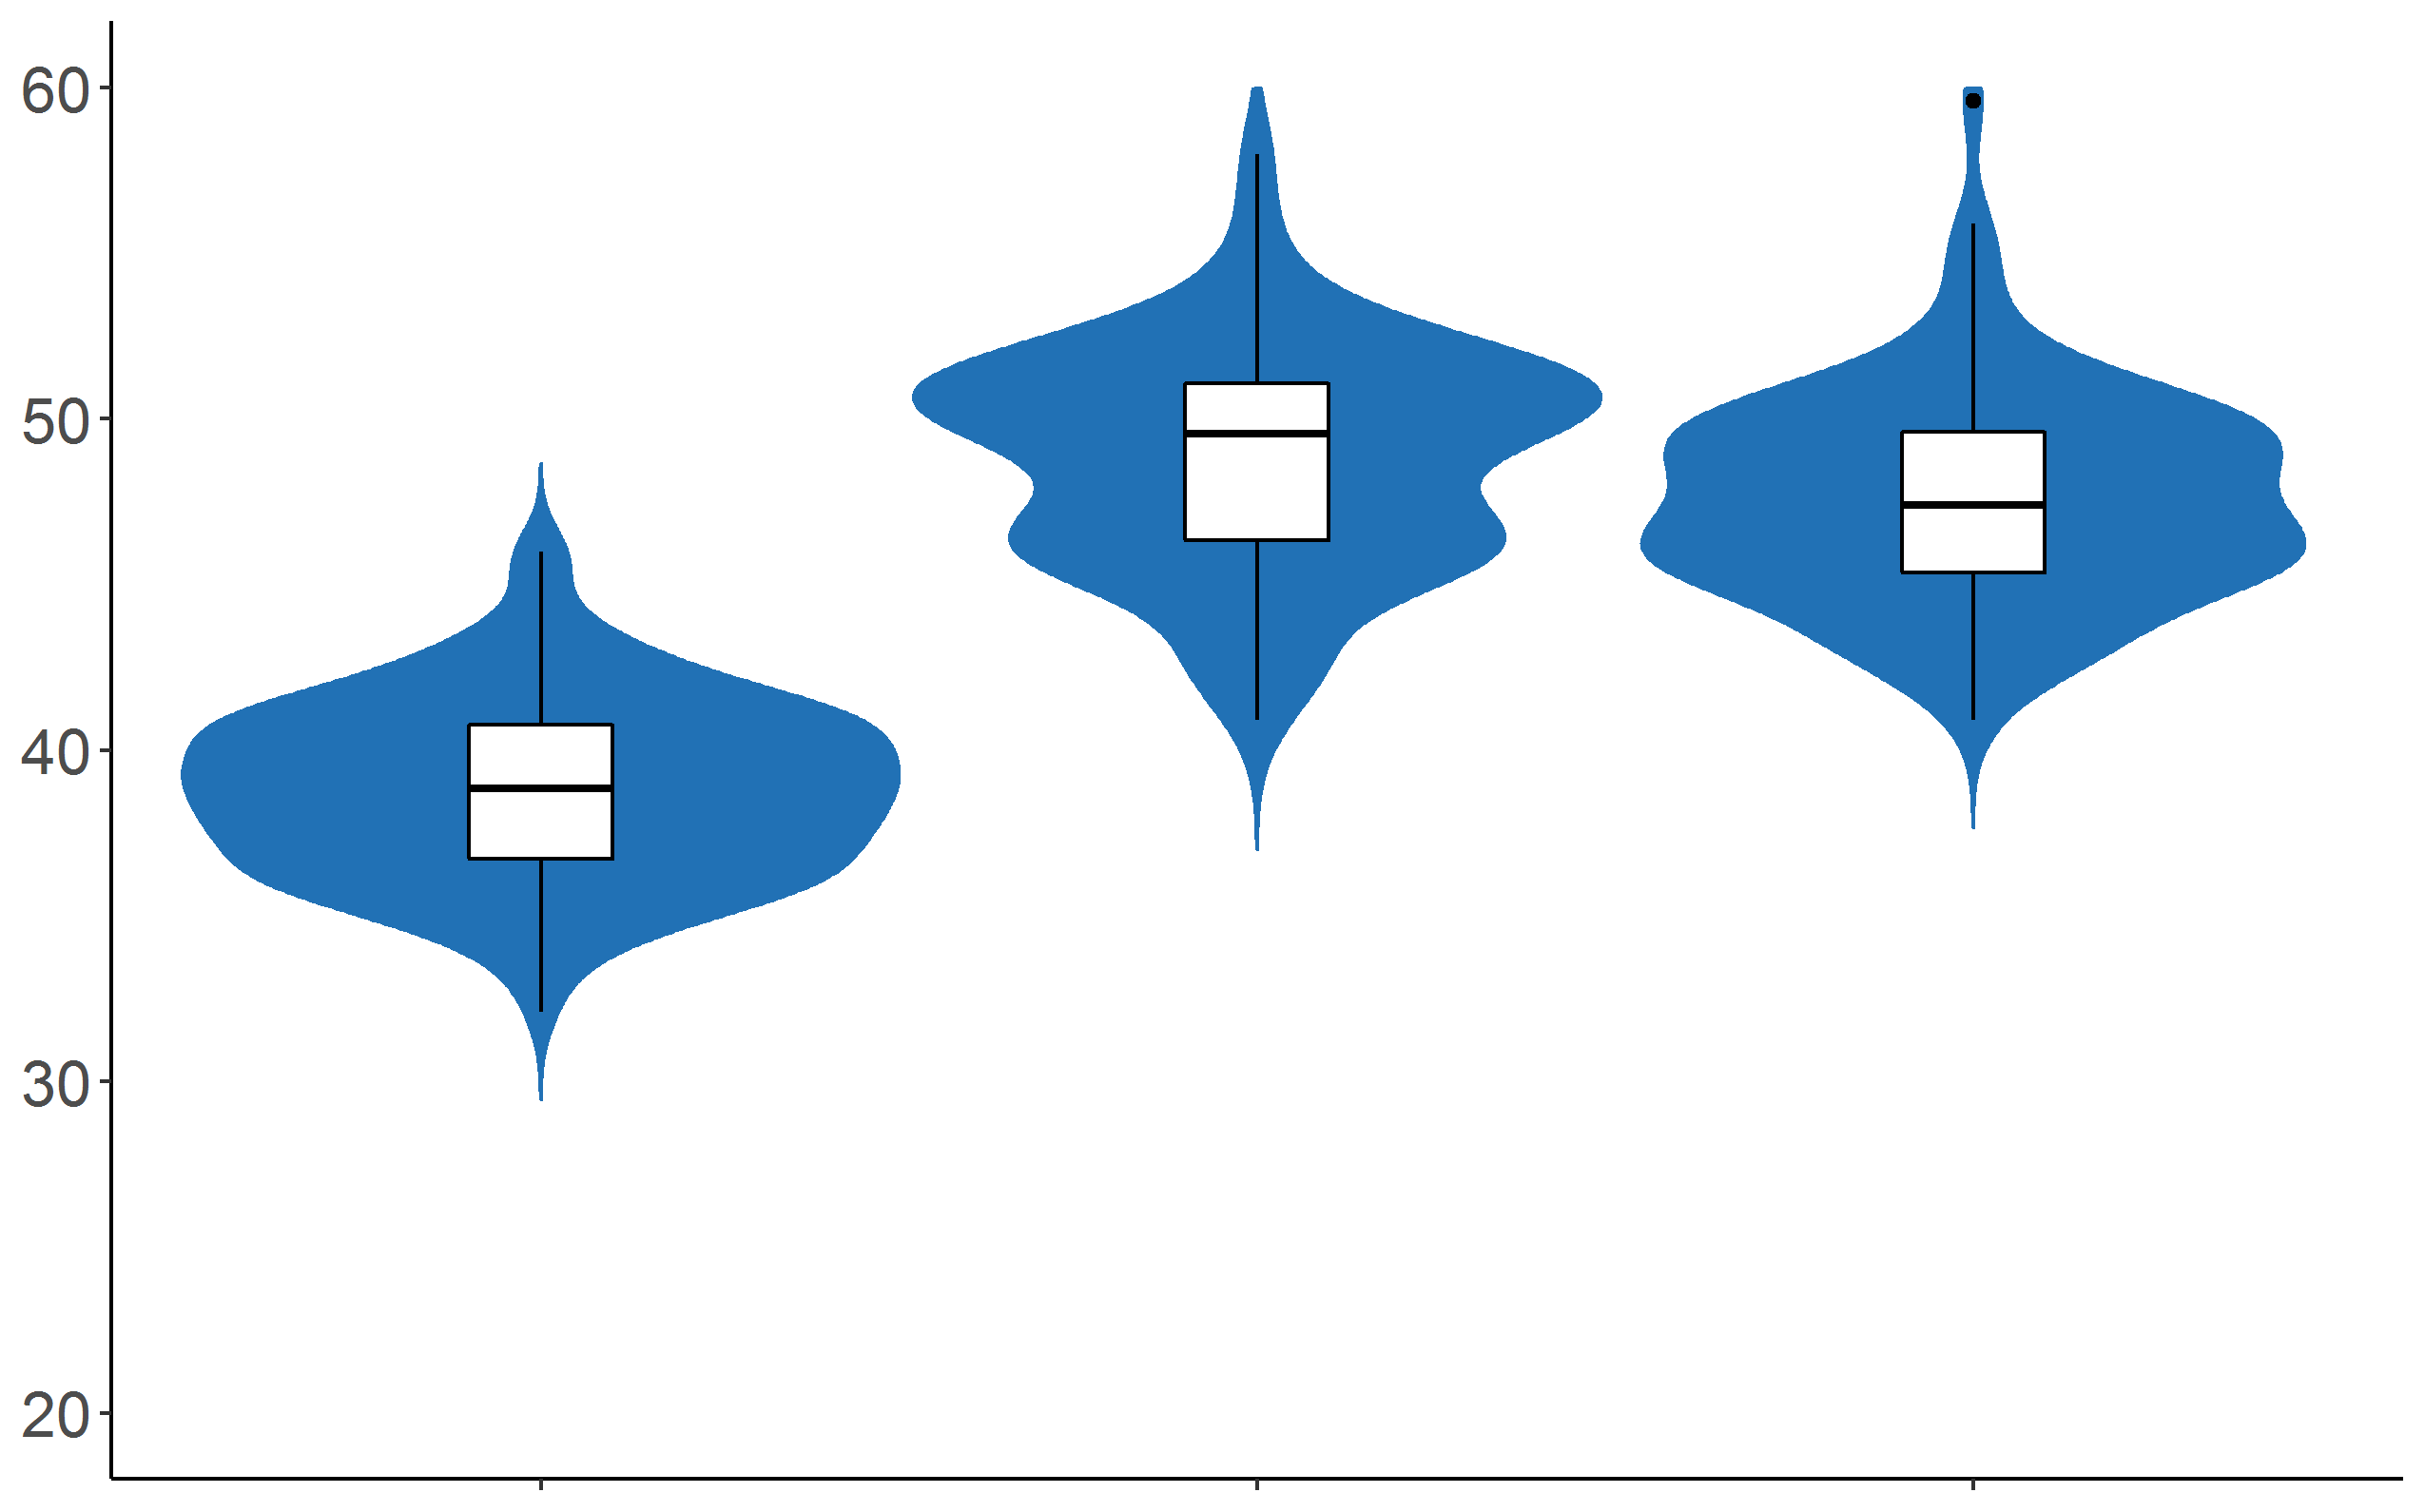
Violin plot
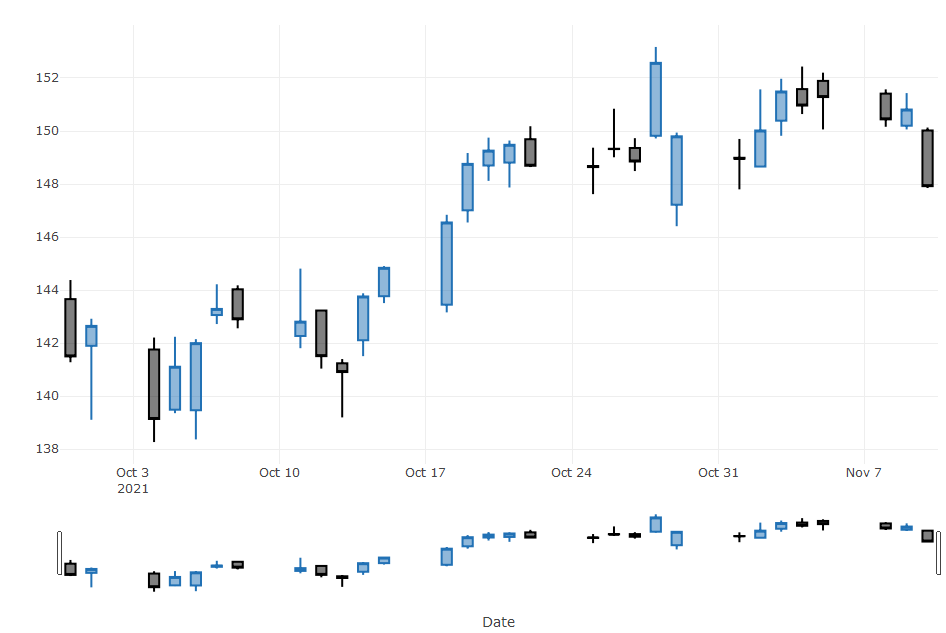
Candlestick plot
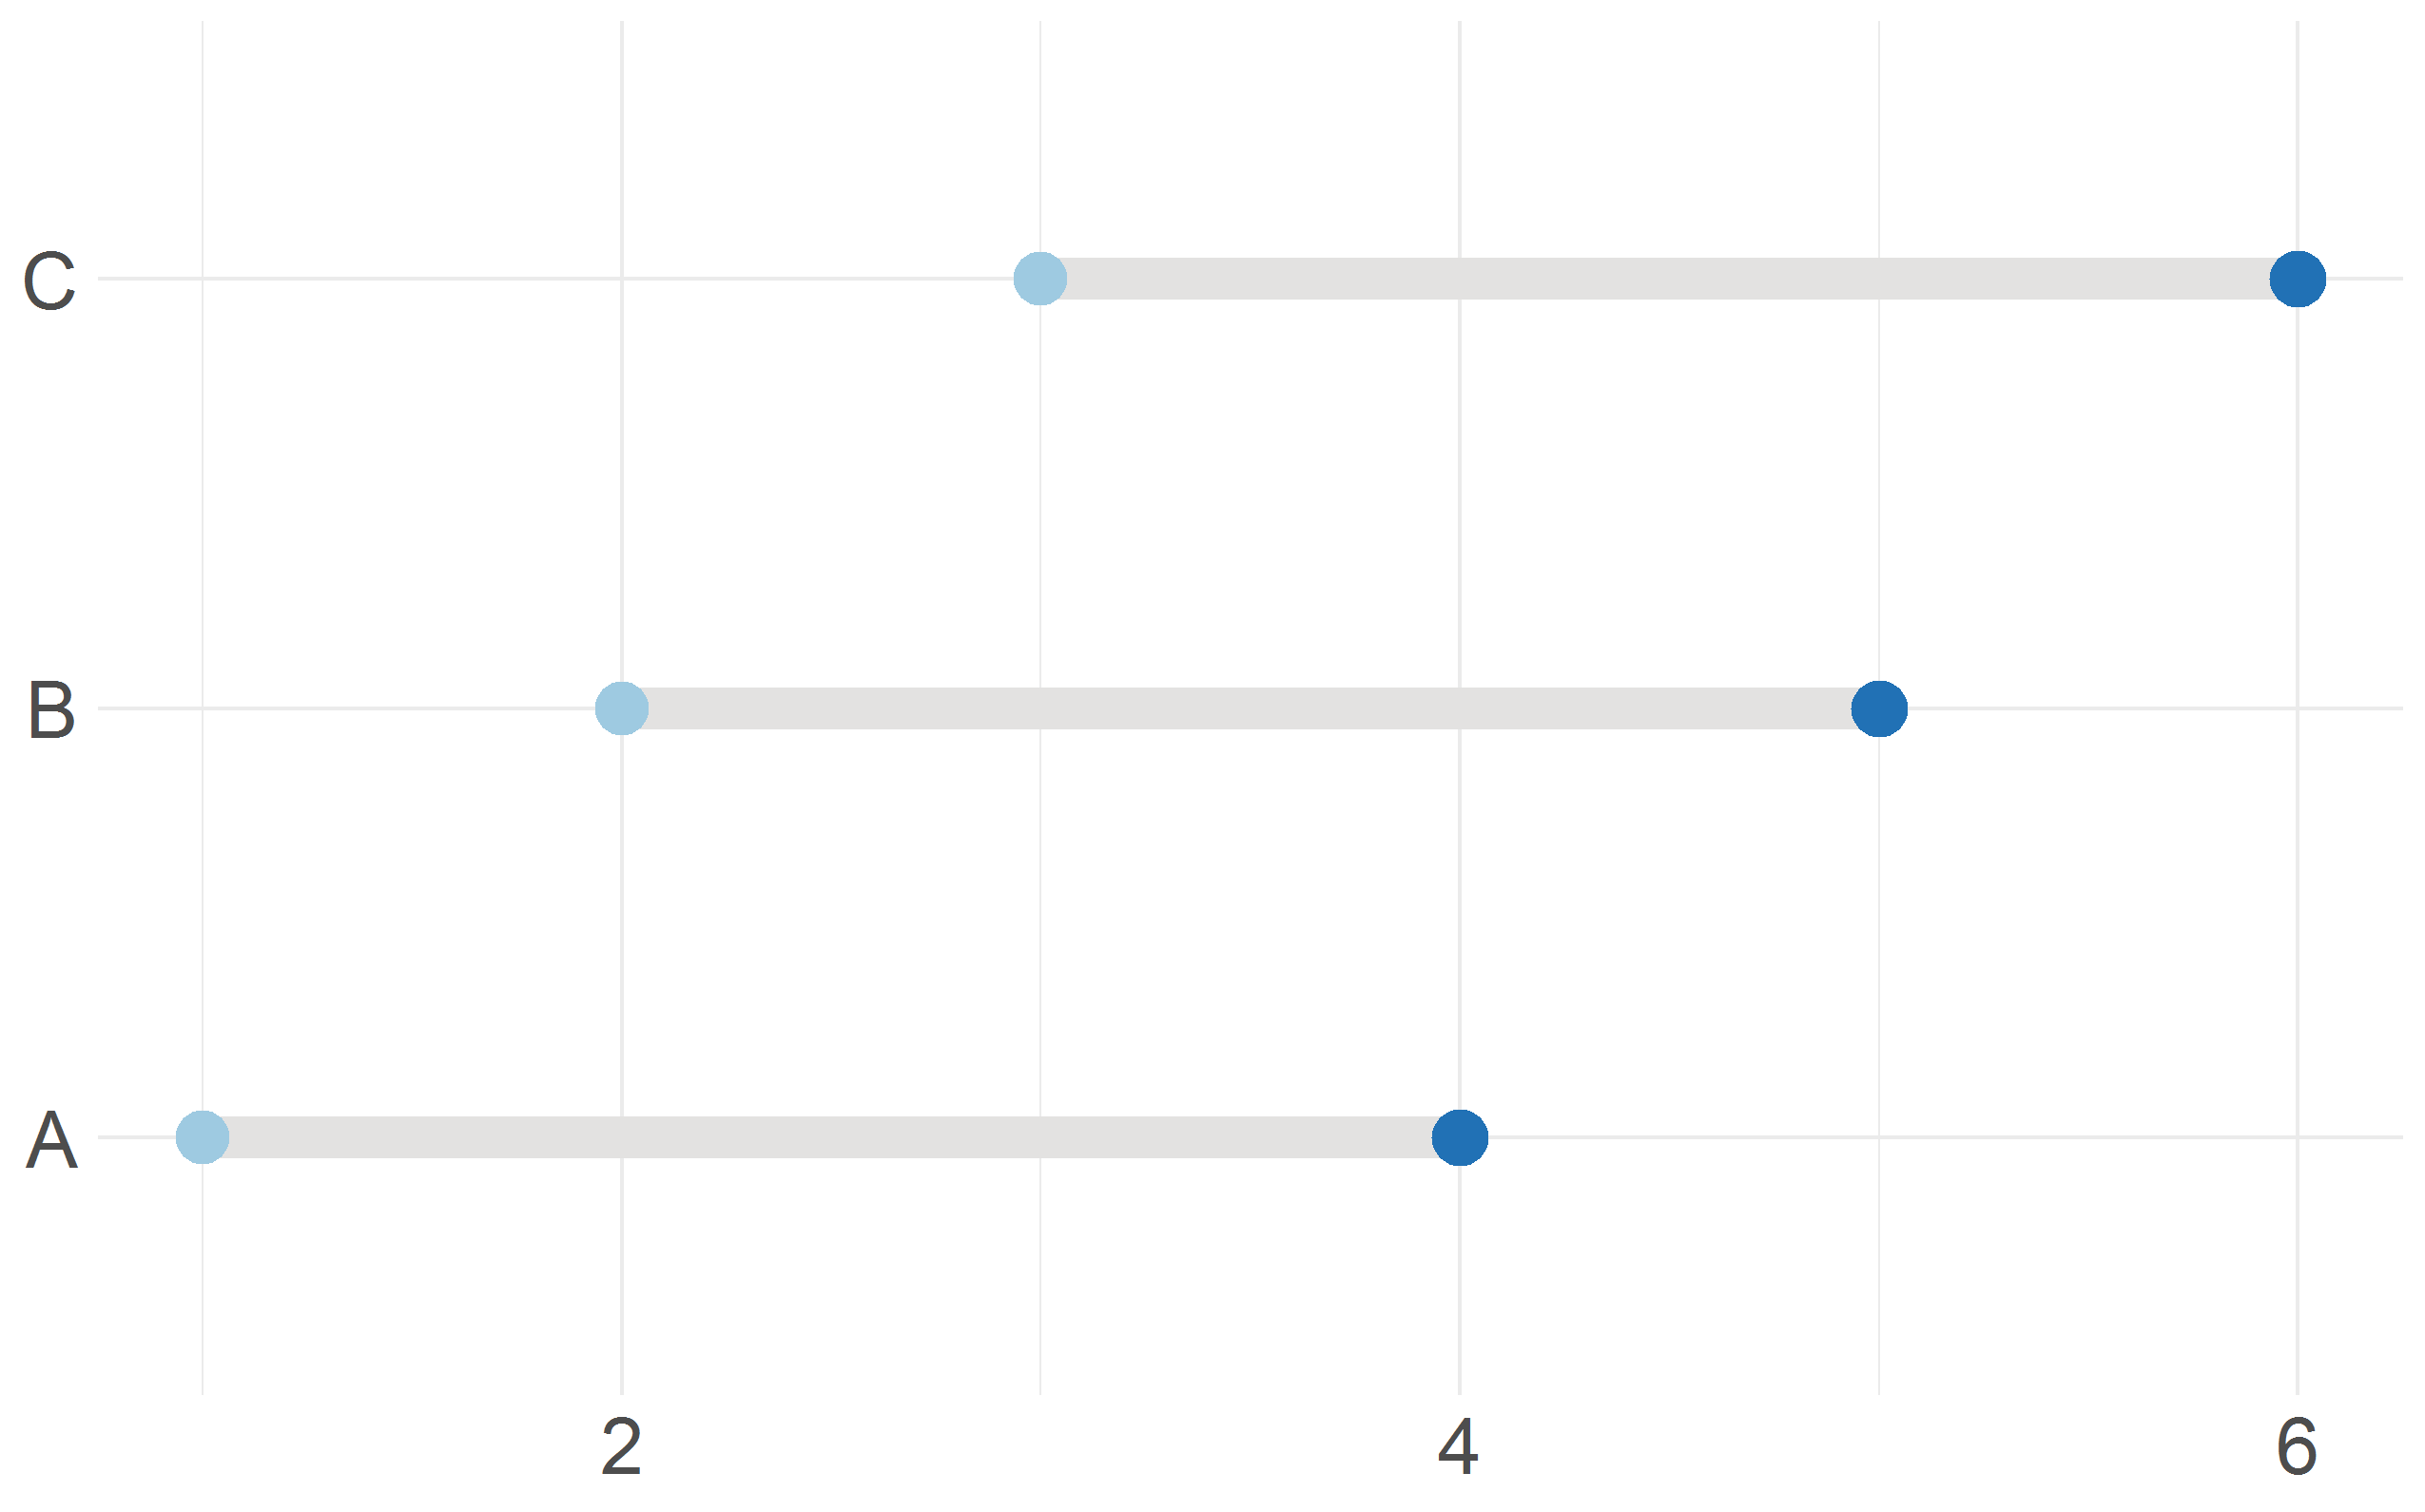
Dumbbell plot
Parliament plot

Rank Chart
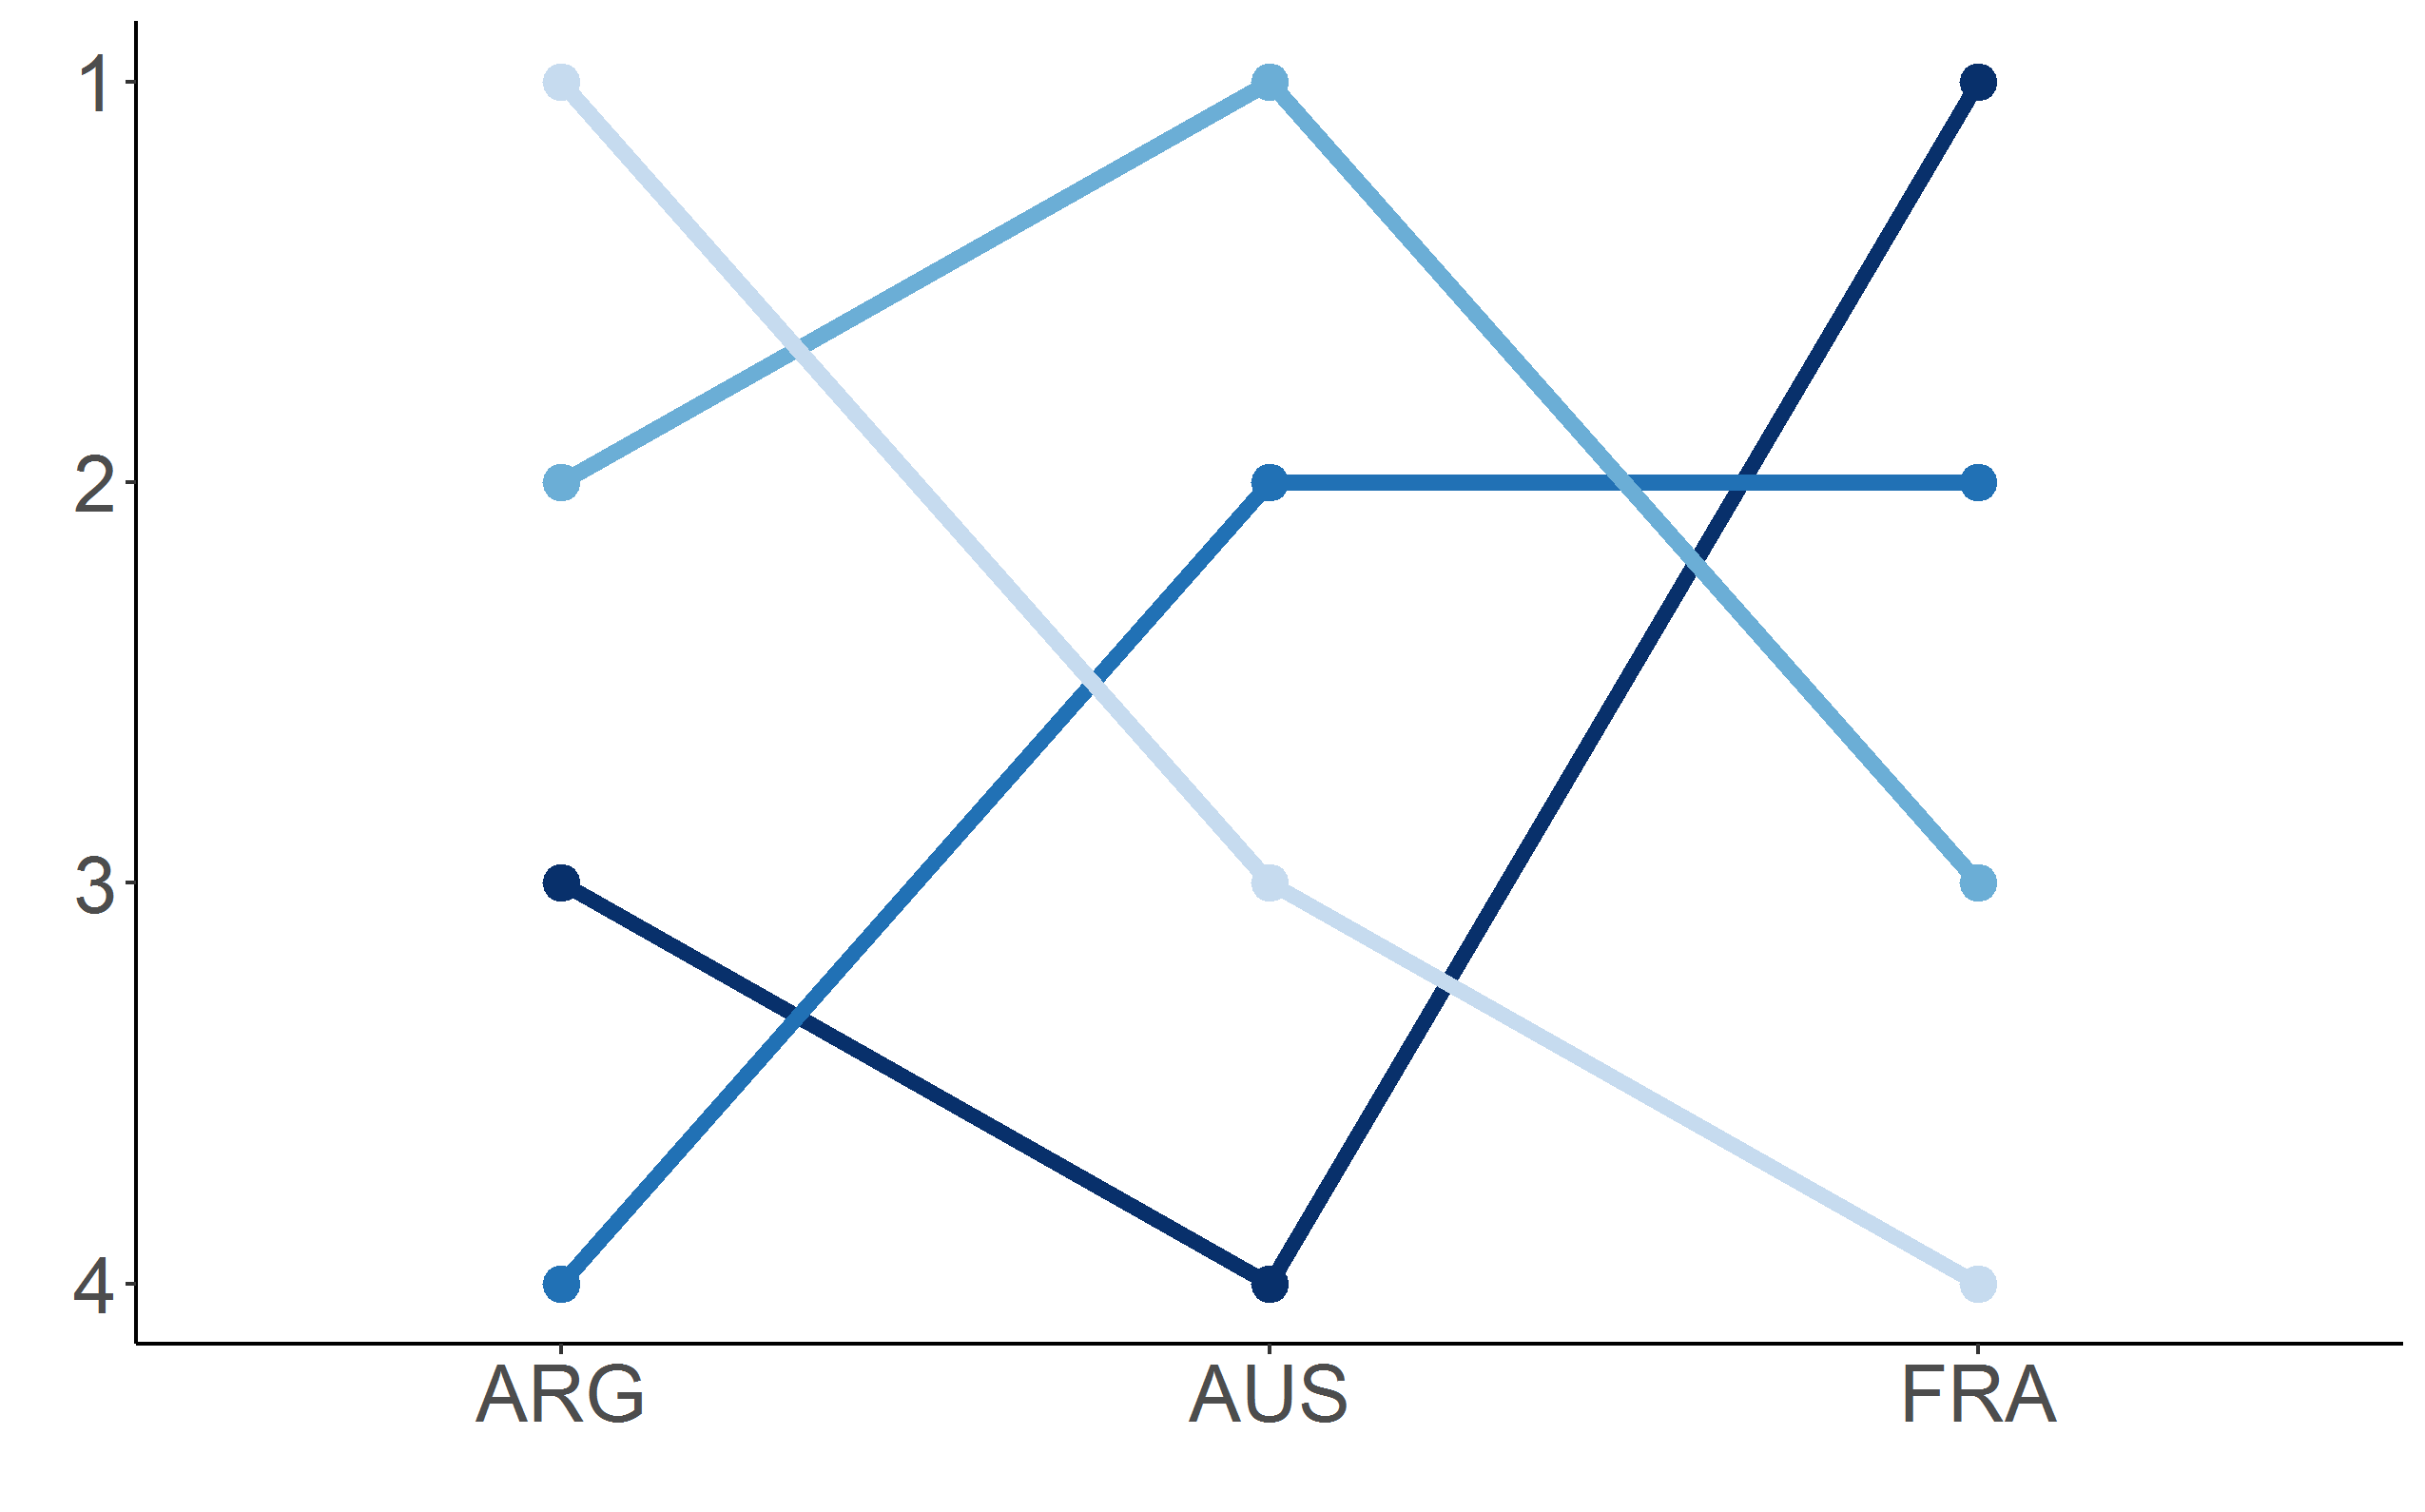
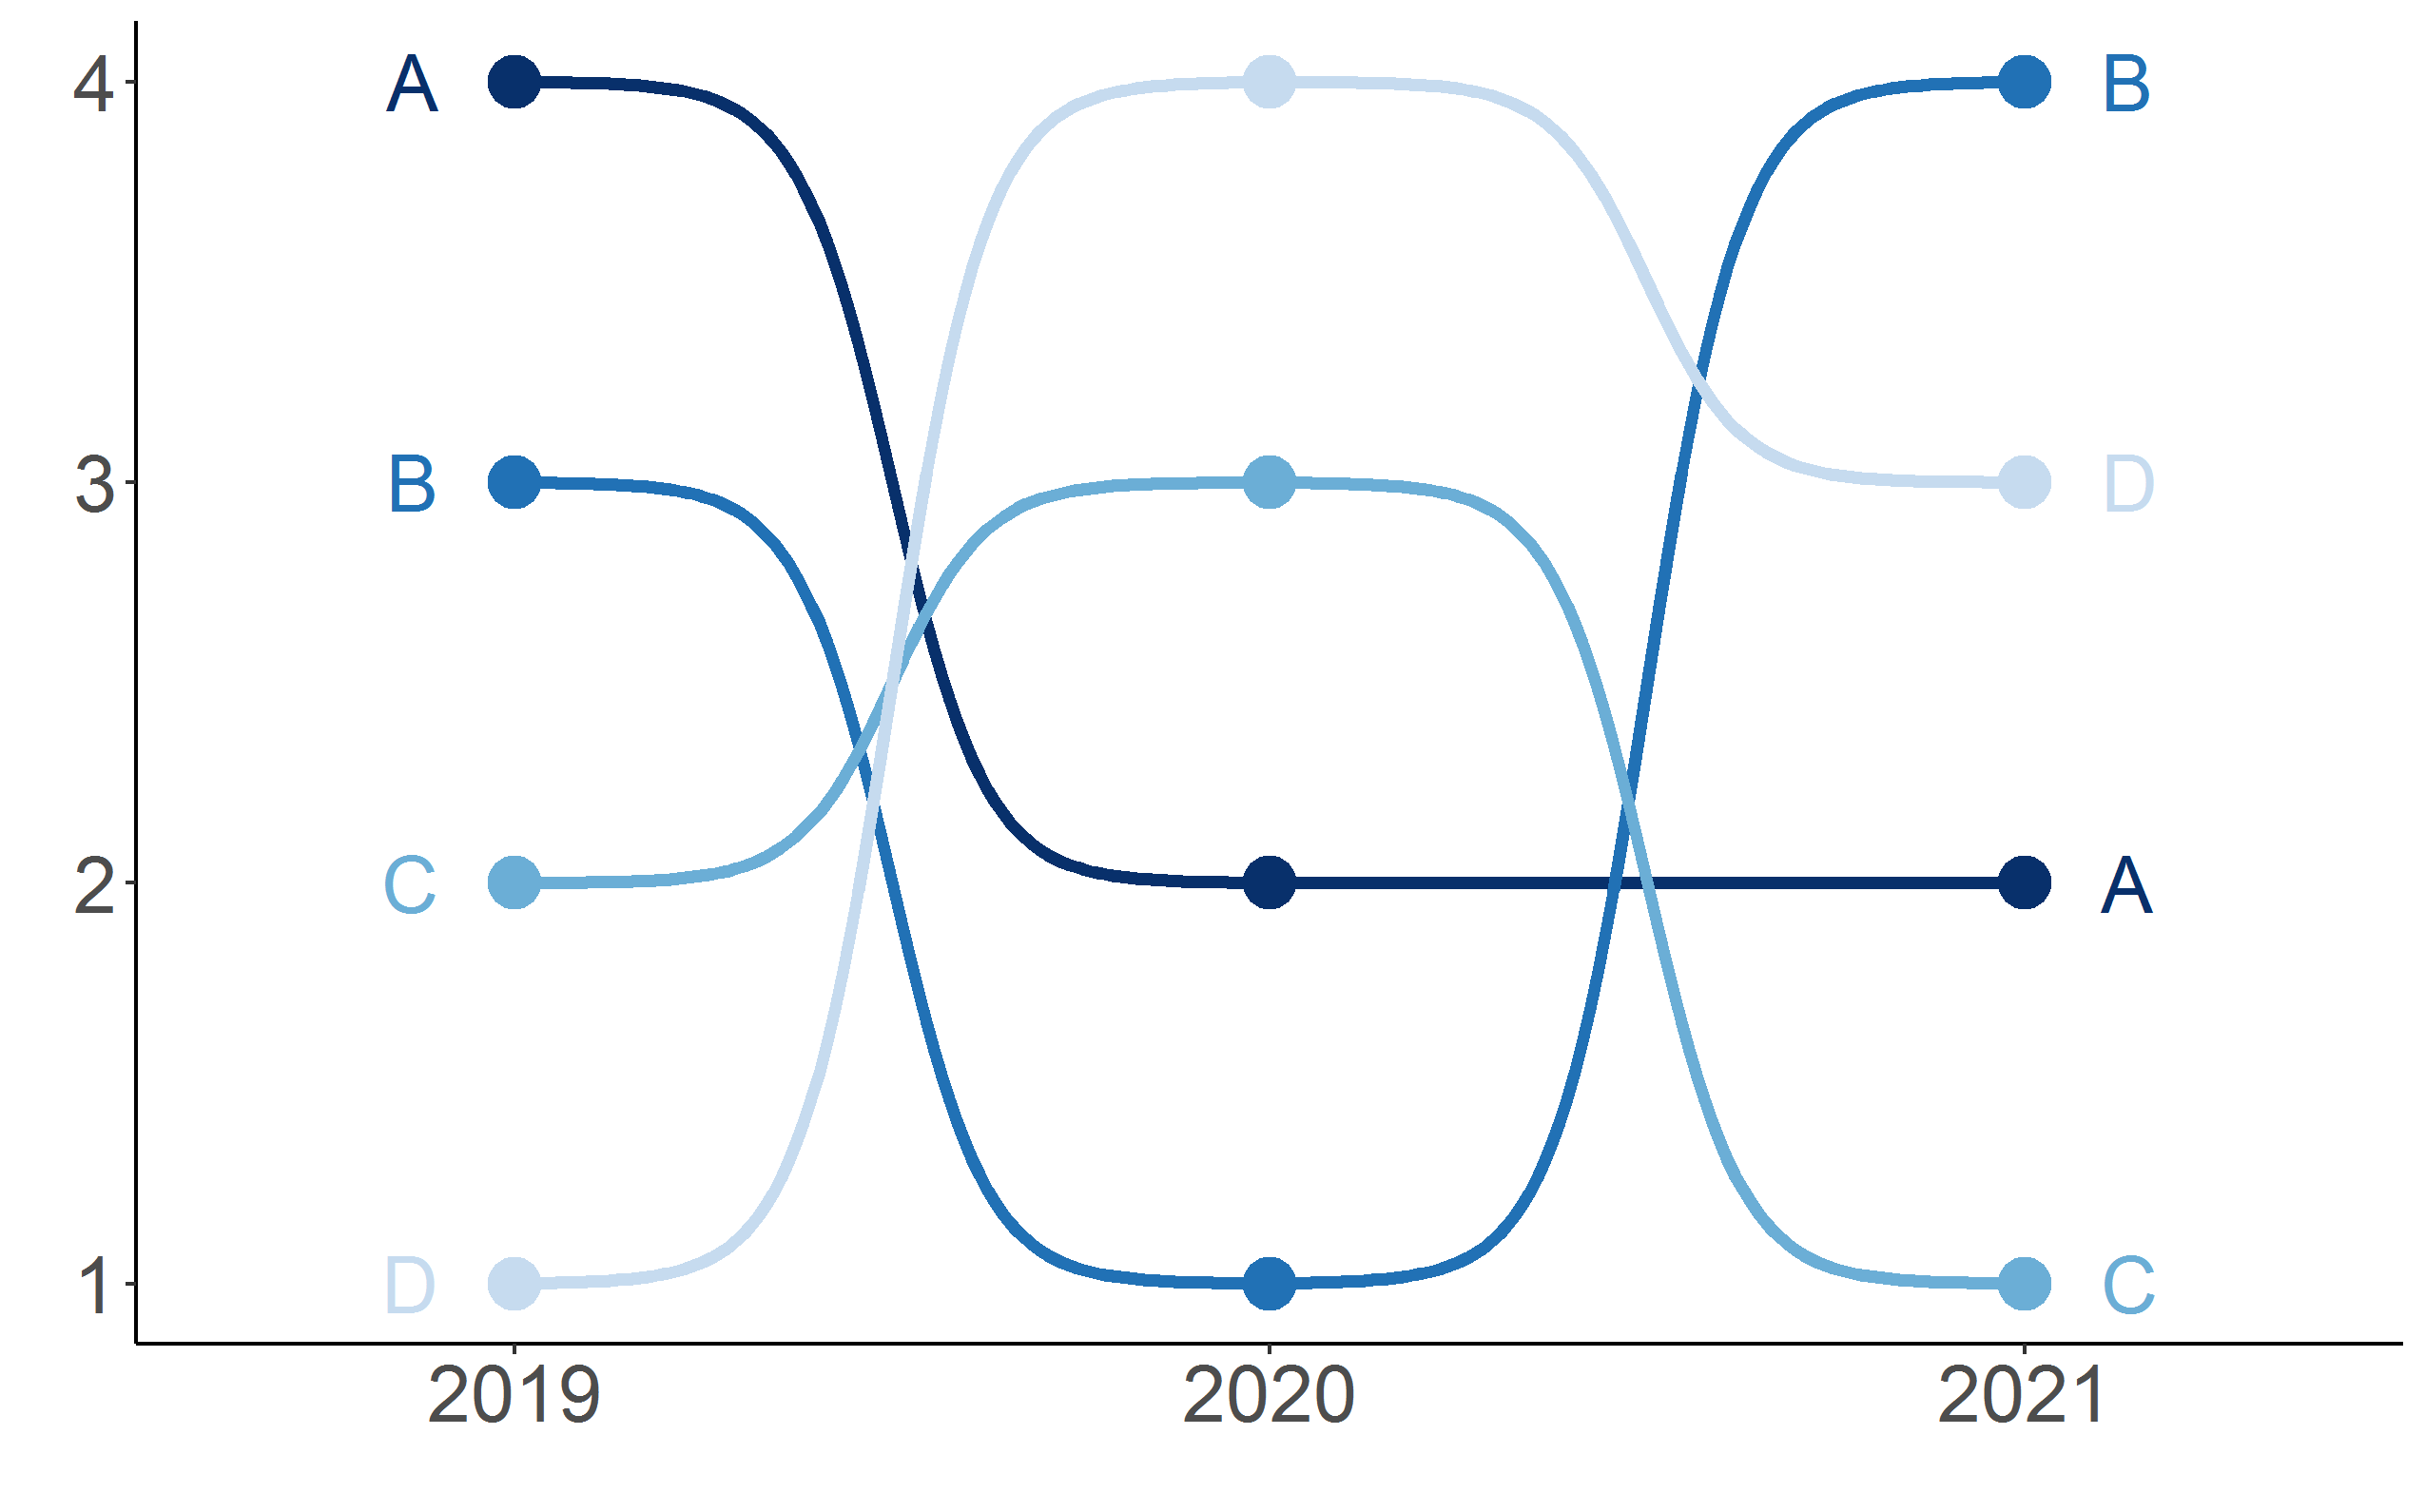
Bump Chart